Article Text

Abstract
Rationale: In cystic fibrosis (CF), lung disease is the predominant cause of morbidity and mortality. Little is known about the spectrum of structural abnormalities on CT scans from patients with CF with severe advanced lung disease (SALD). No specific CT scoring system for SALD is available.
Objectives: To design a quantitative CT scoring system for SALD, to determine the spectrum of structural abnormalities in patients with SALD and to correlate the SALD system with an existing scoring system for mild CF lung disease and pulmonary function tests (PFTs).
Methods: 57 patients with CF contributed one CT made during screening for lung transplantation. For the SALD system, lung tissue was divided into four components: infection/inflammation (including bronchiectasis, airway wall thickening, mucus and consolidations), air trapping/hypoperfusion, bulla/cysts and normal/hyperperfused tissue. The volume proportion of the components was estimated on a 0–100% scale; mean volumes for the whole lung were computed. Scores were correlated with Brody-II scores and PFTs.
Results: The SALD system identified a wide spectrum of structural abnormalities ranging from predominantly infection/inflammation to predominantly air trapping/hypoperfusion. SALD infection/inflammation scores correlated with Brody-II scores (rs = 0.36–0.64) and SALD normal/hyperperfusion scores correlated with forced expiratory volume in 1 s (FEV1; rs = 0.37). Reproducibility for both systems was good.
Conclusions: A CT scoring system was developed to characterise the structural abnormalities in patients with SALD. A wide spectrum was observed in SALD, ranging from predominantly air trapping to predominantly infection/inflammation-related changes. This spectrum may have clinical implications for patients with SALD.
Statistics from Altmetric.com
Since the first description of cystic fibrosis (CF) in 1938, patients’ life expectancy has greatly improved. Thanks to better treatment that curbs progression of pulmonary disease,1 2 life expectancy is now around 40 years,3 and over 40% of CF patients are adults.4 Nevertheless, most patients still develop severe advanced lung disease (SALD), the predominant cause of mortality in CF.
Little is known about the structural abnormalities in SALD, as few pathology studies are available. These studies used lung specimens from transplant and/or autopsy procedures to describe the structural changes in SALD.5 6 7 To the best of our knowledge, no systematic studies have investigated SALD in vivo. Routine chest CT scans from patients with CF made for screening for lung transplantation may be used for this purpose. Knowledge of the structural changes in SALD is important, as it may indicate which structural abnormalities in CF lung disease can lead to SALD and, hence, have to be monitored and treated in patients with early disease to prevent progression to SALD. Furthermore, it may give more insight into clinical differences and outcomes in patients with SALD. When SALD has established, lung transplantation is often the only treatment option left. To date, it has been a major challenge to determine which patients with SALD have the highest risk of dying, and are thus most in need of a lung transplant. This is reflected in reported mortality estimates for patients awaiting transplantation, which range from 15% to 40%.8 9 10 Currently used prediction models for waiting list survival in these patients include clinical parameters, but no information on lung structure. CT may add important information to these prediction models, as it was proven to be more sensitive to detect and monitor CF lung disease than pulmonary function tests (PFTs).1 11 12 13 We speculate that the patient’s clinical outcome may be impacted by the type of structural lung abnormality observed on CT. Our hypothesis is that, based on our clinical impression, a spectrum of abnormalities can be observed in SALD, ranging from predominantly infection/inflammation-associated changes such as consolidations and bronchiectases to hypoventilation-associated changes such as air trapping and hypoperfusion.
To test this hypothesis, a scoring method is needed to quantify the structural abnormalities in SALD in a systematic, objective and time-efficient fashion. Current scoring systems, such as the Brody-II system, are reproducible,14 but were primarily designed to quantify early and moderately advanced disease.11 15 16 For the CT scans of patients with SALD, a dedicated SALD scoring system may be more sensitive to detect differences in disease spectrum between patients.
Therefore, we aimed to (1) design a CT scoring system for the CT abnormalities of patients with SALD; (2) correlate this new system with the Brody-II system and PFTs; and (3) investigate the spectrum of structural abnormalities on CT scans of patients with CF who have SALD.
Methods
Study population
In this retrospective study, data from patients with a confirmed diagnosis of CF and screened for lung transplantation between 2001 and 2005 were collected in three transplant centres. Patients were only included when screening data, including a chest CT scan, were available. Patient characteristics are defined in the online supplement. Screening criteria were based on internationally used recommendations,8 17 18 19 20 although one centre (centre 3 in the analysis) used a forced expiratory capacity in 1 s (FEV1) of <25% for males and of <40% for females. The review boards of all three participating centres approved the study protocol and waived informed consent.
CT scanning procedures and scoring
Lung structure was evaluated with CT scans. Eight CT scanners (characteristics in online supplement) were used in this study. CT scans were anonymised before evaluation and analysed in random order. A single experienced observer scored all scans using the Brody-II scoring system11 and a newly developed SALD scoring system. Reproducibility within and between observers was determined for both systems. Within-observer agreement was tested by re-scoring a random subset of 25 scans. For between-observer agreement analysis, an independent experienced second observer scored a random subset of 25 scans. Both observers were blinded for clinical data and outcome of the patients.
Brody-II scoring system
This system evaluates bronchiectasis, airway wall thickening, mucus plugging and opacities on inspiratory images and air trapping on expiratory images.11 As expiratory images were lacking in 45/57 patients, the maximal possible total Brody-II score (207 points) was reduced by the air trapping score (27 points), thus changing the upper limit to 180 points. To enable direct comparison, scores were recalculated and expressed as percentages of the maximal possible score on a scale of 0 (no disease) to 100 (maximal lung disease).
SALD scoring system
The development of the SALD system is described in the online supplement. In brief, the SALD score aims to divide the total lung volume into four mutually exclusive and comprehensive components of lung morphology, each assessed on a 0–100% scale. Three components indicate abnormalities: (1) infection/inflammation, which includes bronchiectasis, airway wall thickening, mucus and consolidations; (2) air trapping/hypoperfusion; and (3) bulla/cysts. The fourth category, normal/hyperperfused tissue, reflects parenchyma that is normal or hyperperfused due to a redistribution of blood caused by perfusion defects. This tissue is still thought to contribute to normal gas exchange. For all CT slices (one slice per 10 mm), the observer estimated the percentage of total lung area to be assigned to each component. Then, for each component separately, the volume estimates from all slices were summed and the sum was divided by the number of slices to obtain mean volume estimates. High scores for the first three categories reflect a high volume of structurally changed lung tissue and, thus, severe disease. A high score for the normal/hyperperfusion component reflects a high volume of relatively normal lung tissue. Thus, in the SALD system, all lung tissue was assigned to one or more of the four SALD components, with these four component scores adding up to 100%. Therefore, the SALD scoring system consists of only four component scores and does not compute a total score.
Statistical analysis
For continuous and categorical variables, the Kruskal–Wallis and χ2 test were used in the comparison of baseline characteristics between the centres. Correlations between SALD and Brody-II score and between CT scores and PFTs were investigated using Spearman’s correlation coefficients (rs). Reproducibility for both scoring systems was evaluated using intraclass correlation coefficients (ICCs) and Bland–Altman plots. Although no universally applicable standards are available for what constitutes poor, fair or good reliability,21 we considered ICC values between 0.4 and 0.6, 0.6 and 0.8, and ⩾0.80 to represent moderate, good and very good agreement, respectively. SPSS version 14.0 for Windows was used for all statistical analyses. Results are displayed as median (range) unless defined otherwise. A p value of <0.05 was considered significant.
Results
Data were collected from 57 consecutive patients. No significant differences in patient characteristics were observed between the centres, except for some components of the Brody-II system (table 1). SALD component scores for bulla/cysts were excluded from further analyses, since this item was only present in 11/57 (19%) patients.
Patient characteristics and CT scores for the study cohorts in the three transplant centres
CT scoring systems
Between- and within-observer agreement
Between- and within-observer agreement for both scoring systems was good, with most ICC values near or above 0.80 (table 2). Bland–Altman plots showed that differences between the observers were independent of the magnitude of the scores in either scoring system (online supplement).
Between- and within-observer agreement expressed as intraclass correlation coefficients for the Brody-II and SALD scoring system
SALD spectrum
Although all scans showed the SALD components infection/inflammation, air trapping/hypoperfusion and normal/hyperperfusion, there was a striking difference in the extent in which these abnormalities were present (fig 1 and supplementary fig E5 online). Thus, a SALD spectrum could be distinguished ranging from predominantly infection/inflammation to predominantly air trapping/hypoperfusion (fig 2).
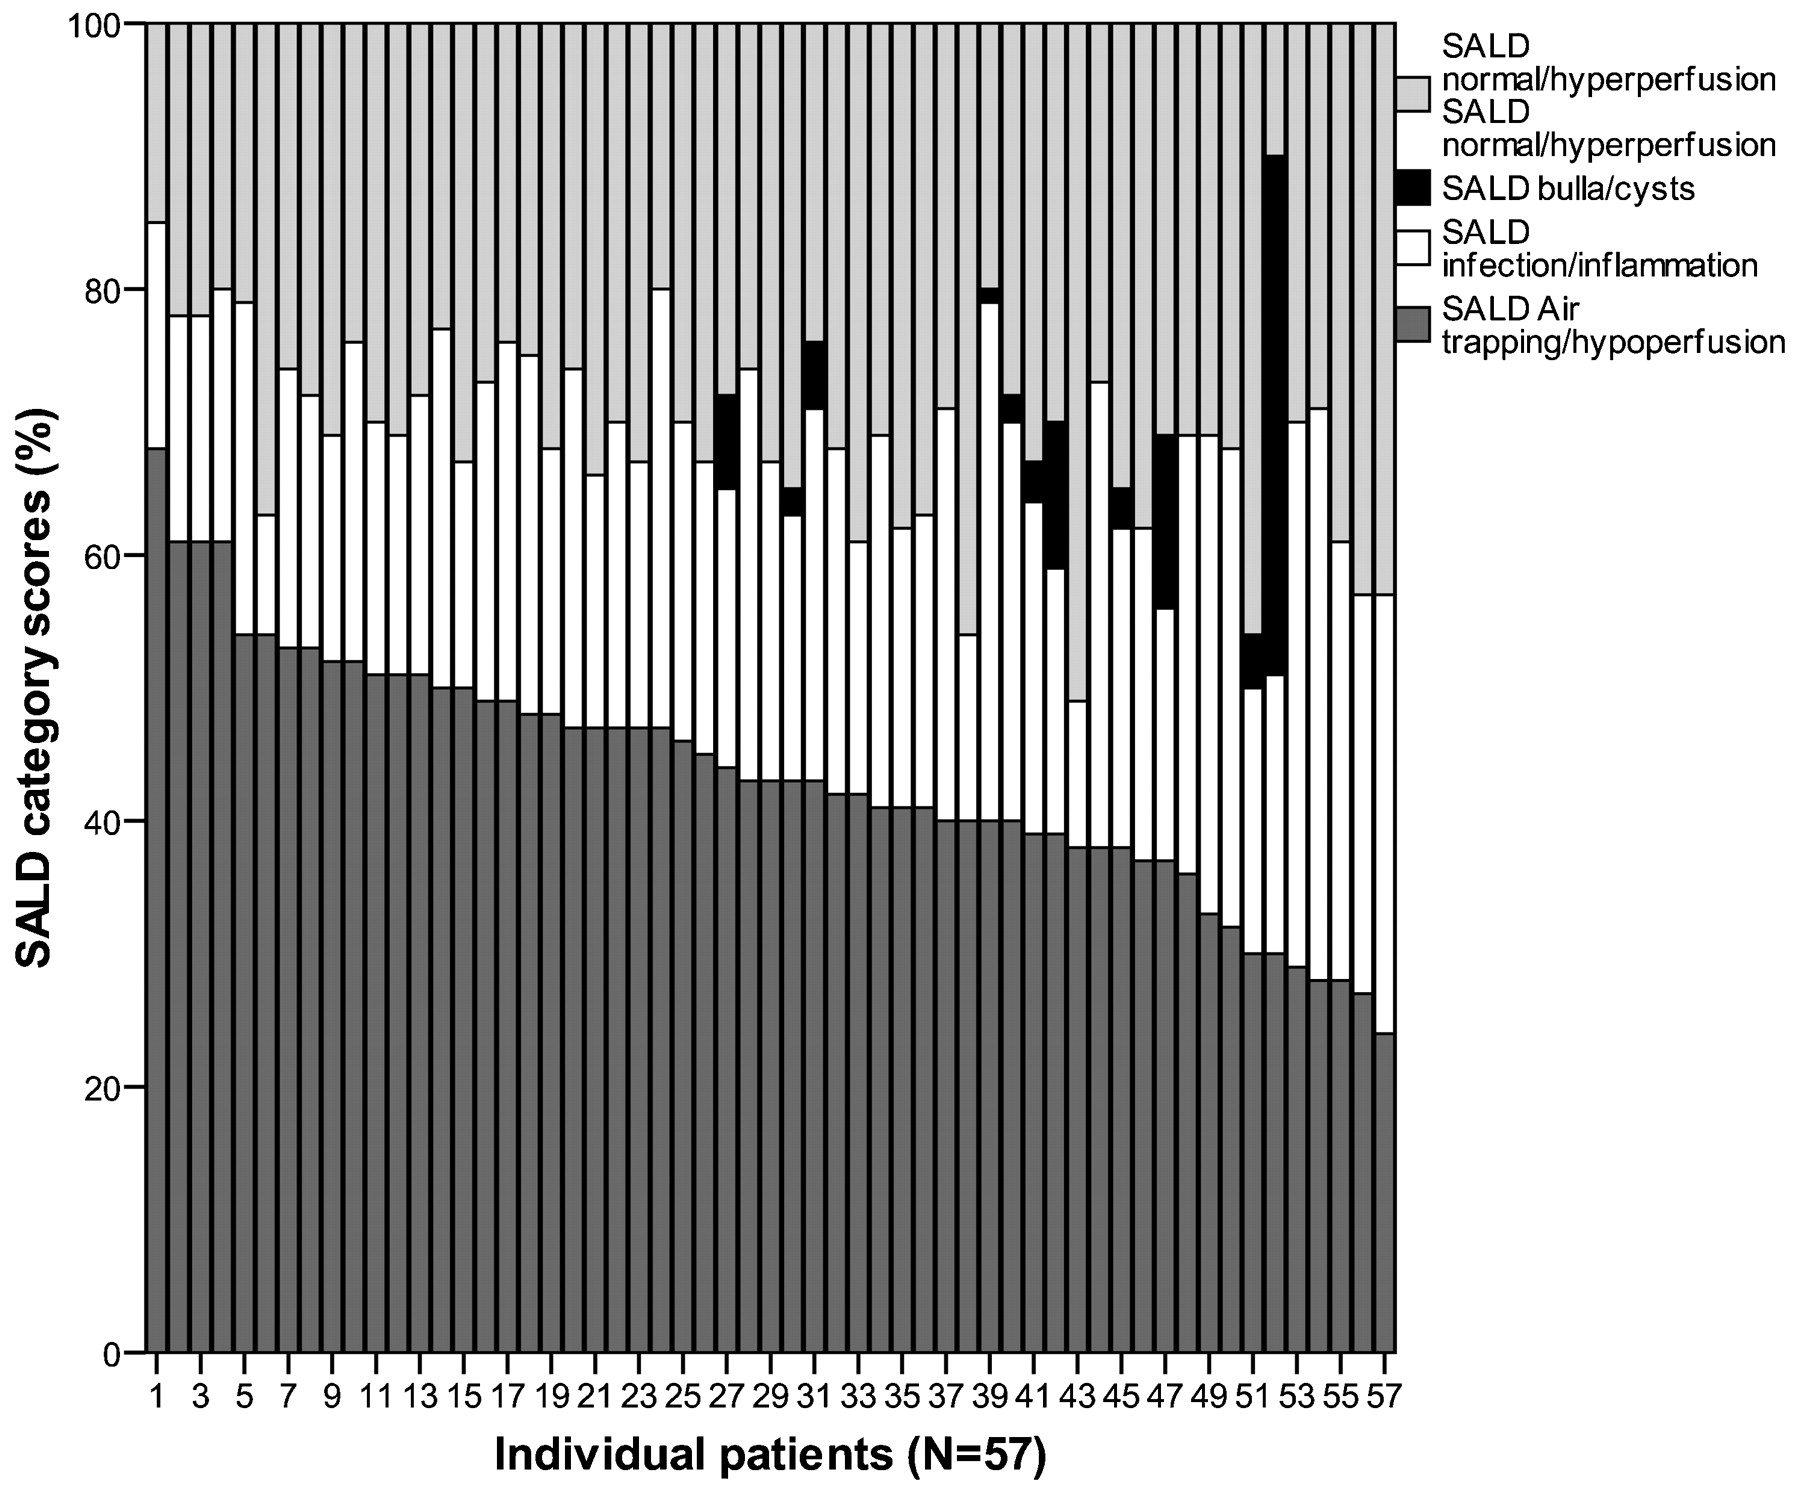
Distribution of the severe advance lung disease (SALD) component scores. CT scans from lung transplant screening were scored according to the SALD criteria. A SALD spectrum was identified in which the dark grey bars represent the lung volume scored as hypoperfused tissue; the white bars infection/inflammation; the light grey bars normal/hyperperfused tissue; and the black bars bulla or cysts. Patients are sorted according to their air trapping/hypoperfusion component. The figure sorted for the infection/inflammation component can be found in the online supplement.

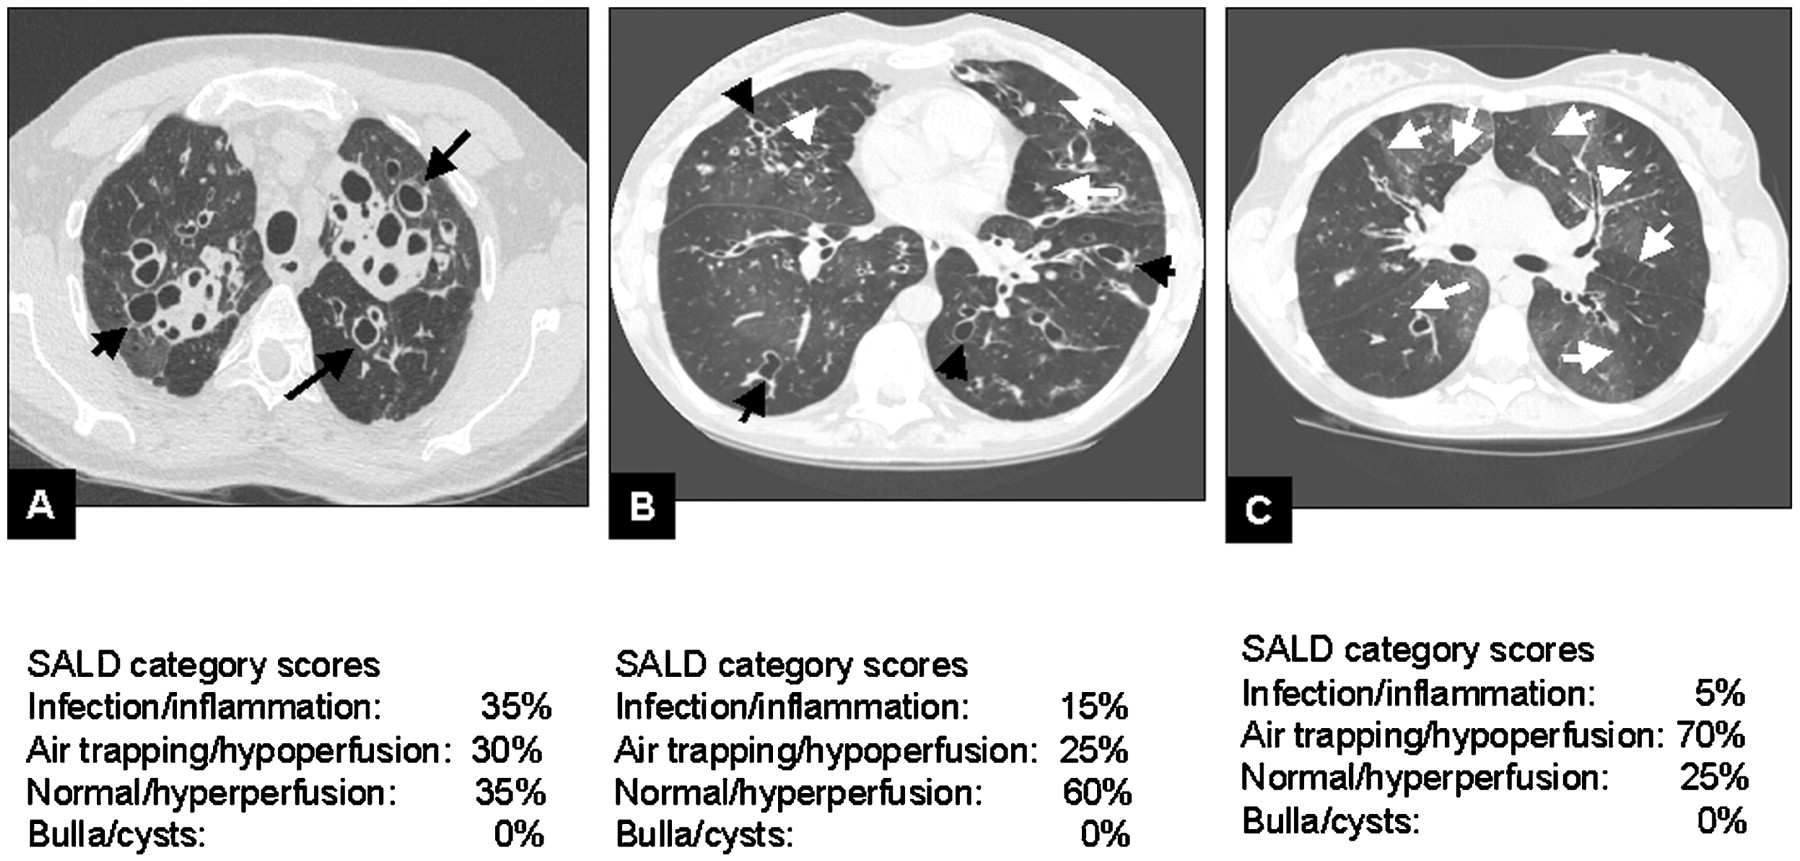
Illustration of the severe advanced lung disease (SALD) spectrum. Images show the spectrum of SALD-related changes in lung morphology and SALD component scores for each image. These range from infection/inflammation-related changes such as bronchiectasis (black arrows) to air trapping/hypoperfusion (white arrows). (A) shows predominantly bronchiectasis, (B) shows a mix of bronchiectasis and air trapping/hypoperfusion, and (C) displays minimal bronchiectasis but extensive air trapping and hypoperfusion.
Correlation between the SALD system and the Brody-II system
Positive correlations were found between the SALD infection/inflammation score and the total Brody-II score (rs = 0.64, p<0.001; fig 3) as well as with each of the Brody-II component scores: bronchiectasis (rs = 0.59, p<0.001), airway wall thickening (rs = 0.62, p<0.001), mucus plugging (rs = 0.50, p<0.001) and opacities (rs = 0.36, p = 0.006). No significant correlations were found between the SALD normal/hyperperfusion score and the total Brody-II score or any of the component scores.

The correlation between the severe advanced lung disease (SALD) infection/inflammation score and the total Brody-II score.
Correlation between CT scores and PFTs
Total Brody-II score correlated, albeit weakly, with forced vital capacity (FVC) (rs = −0.28, p = 0.035, fig 4) but not with FEV1. None of the Brody-II component scores correlated with FEV1, and only the component score airway wall thickening correlated with forced vital capacity (FVC; rs = −0.31, p = 0.018). None of the SALD components correlated with FVC, and only the normal/hyperperfusion score correlated with FEV1 (rs = 0.37, p = 0.005, fig 4).

Correlation between CT scores and lung function parameters. A shows the correlation between the total Brody-II score and the forced vital capacity (FVC), while B displays the correlation between the severe advanced lung disease (SALD) air trapping/hypoperfusion score and the forced expiratory volume in 1 s (FEV1).
Discussion
To our knowledge, this is the first study in CF that systematically describes the structural abnormalities on CT scans from patients with CF with SALD screened for lung transplantation. The most important finding of this study is the wide disease spectrum that was identified in patients with SALD in vivo, using the newly developed SALD scoring system. At one end of the spectrum, patients had predominantly infection/inflammation-related changes and at the other end predominantly air trapping/hypoperfusion. The observed structural abnormalities have been described in pathology studies, which revealed the presence of inflammation, atelectasis, bronchiestasis, fibrosis, cyst formation, airway wall thickening and a substantial loss of cartilage.5 6 7 In these pathology studies, it was well recognised that these abnormalities were unevenly distributed throughout the lung. However, whether substantial differences in disease spectrum between patients could be observed was not studied.
Infection/inflammation, which included bronchiectasis, was found to be an important disease component in SALD. The importance of bronchiectasis in CF has been well recognised.22 23 24 Hence, prevention of bronchiectasis is an important treatment target in patients with SALD. A striking observation is the finding that air trapping is another important disease component in many patients with SALD. In some patients, it was clearly the predominant morphological substrate for their severely impaired lung function. Air trapping has been observed early in the disease process of CF.25 26 In a small randomised controlled study, it was shown that treatment with dornase alpha in patients with mild to moderately severe CF lung disease reduced air trapping on CT and improved peripheral airway obstruction.27 These results suggest that air trapping may be reversible when treated early. Clearly, this warrants further investigation.
Our observation is not only important in terms of prevention of SALD, but can also be relevant for the management of patients with SALD. We feel that more tailored treatment of the subtypes in SALD at an earlier stage of the disease has the potential to reduce mortality and improve the quality of life. It is likely that the therapeutic strategy for SALD patients with predominantly bronchiectasis should be different from that of patients with predominantly air trapping. Whether air trapping in patients with CF who have SALD is reversible is unknown. To the best of our knowledge, no systematic therapeutic studies have been performed with the aim of reducing the severity of air trapping in patients with CF who have SALD. The effect of dornase alpha in patients with CF with advanced disease has been studied; air trapping, however, was not included as an endpoint.28 This needs to be further investigated in clinical studies. In addition, we think that the CT information of patients with SALD may improve patient selection for lung transplantation. Currently used selection criteria comprise predicted FEV1 <30%, rapid respiratory deterioration with predicted FEV1 >30%, PaCO2 >50 mm Hg and/or PaO2 <55 mm Hg on room air, and/or females <18 years of age with FEV1 >30% and rapid deterioration.8 17 18 19 20 Several studies have aimed to identify better predictors of survival, but, remarkably, CT-related parameters were never evaluated.8 17 18 It has been suggested that patients with SALD and predominantly infection/inflammation-related changes on their CT have a poorer prognosis than patients with predominantly air trapping/hypoperfusion.29 If so, the SALD score infection/inflammation may be able to contribute to survival prediction models independently of lung function-related parameters. A large multicentre study is currently ongoing to investigate this further.
Correlating CT scores with PFT parameters revealed only one significant association—that is, between the SALD air trapping/hypoperfusion score and FEV1. None of the Brody component scores correlated significantly with FEV1. A likely explanation is the limited range in FEV1 in this cohort (from 13% to 45% predicted), and/or the limited sample size. These correlations will be further investigated in our large multicentre study.
In this study, the reproducibility of the SALD scoring system in the evaluation of SALD-related structural abnormalities was comparable with that of the Brody-II scoring system. However, there are several reasons why we consider the SALD scoring system to be more attractive for further development than the Brody score. First, the SALD system is probably easier to automate than the Brody system, as it is based on differentiation between areas with high density (infection/inflammation) and low density (air trapping). This in contrast to the Brody-II system, which is based on pattern recognition, and therefore difficult to automate. Automated analysis can probably further improve the SALD system’s reproducibility. A challenge for the automated approach, however, will be the range of CT scanners and scan protocols used in transplant centres, which probably affects density parameters. The semi-quantitative scoring systems used in this study are less sensitive for technical differences than currently available automated systems.30 A short-term option to improve the precision of the SALD system is to use a digital grid to estimate the volume of the components, a method shown to be feasible for volumes of air trapping.31 Secondly, the SALD system is easier to learn than the Brody-II system. The latter requires estimating the severity of lesions, has more components and requires classifying abnormalities per lobe. Thirdly, SALD scores are continuous variables representing the volume of abnormal lung tissue involved in infection/inflammation, air trapping and normal tissue. Hence, it is easy to understand what the scores mean. This in contrast to the Brody scores, which are computed of scores for severity and extent of an abnormality. This makes it complicated to understand what the scores mean for the patient.
The development of an automated method for the SALD system is important. Currently, the most important drawback for the clinical use of the current SALD system is its time-consuming nature. The SALD system requires 45–60 min to score a single CT examination while the Brody-II system requires only 20 min. An automated approach can make the SALD scoring more time-efficient and, therefore, more accessible for clinical use. Currently, we would recommend using the SALD scoring system solely to evaluate SALD CT scans. It provides insight into the predominant features of the abnormalities on the CT scans. This system has not yet been validated, however, for patients with mild to moderately advanced lung disease. Our next step, therefore, will be to validate the SALD system further in a large cohort and to study correlations between SALD scores and clinical outcome. In this analysis, we may include the observation of bullae/cysts in the air trapping/hypofusion component, since this reflects lung tissue not contributing to gas exchange, and which probably shows little inflammatory change.
This study has a few limitations. First, we used CTs that were obtained with eight different CT scanners and scanning protocols. This may have introduced some bias related to differences in resolution and density distribution. However, we consider it unlikely that this should have affected observation of the substantial differences in disease spectrum present in the patients. Before scoring, images were assessed on image resolution and movement artefacts. All were found to be of sufficient quality for scoring, with good reproducibility, so we may assume that the use of different scanners was non-differential. In addition, manual semi-quantitative scoring systems generally are thought to be less sensitive to differences between CTs and protocols.30 32 Secondly, the correlations between the components of the two scoring systems were limited by the absence of air trapping scores since expiratory scans were only available in 12/57 patients (21%). Evidently, expiratory images were not routinely included in the screening protocols before 2005. The absence of expiratory images probably had more impact on the Brody-II scores than on the SALD scores, as air trapping in the Brody system was completely excluded. The SALD component air trapping/hypoperfusion most probably included areas that would have been classified as air trapping on expiratory images. Thirdly, we cannot be sure that the morphological features on CT adequately reflect the histology of these abnormalities. Several studies have shown correlations between CT morphology and histological findings, although none of them included patients with CF.33 34 35 However, a study in patients with idiopathic pulmonary fibrosis showed that chronic cystic lesions, including bronchiectasis, correlated well with histology. This is in contrast to ground-glass opacities and consolidations on CT, that failed to correlate with histological specimens.33 Additional correlative studies using CT scans and histology from patients with CF could address this issue.
In summary, we designed a CT scoring system specifically for patients with CF who have SALD and tested this retrospectively on 57 CT scans made during screening for lung transplantation. The new SALD system is reproducible, and able to identify a wide spectrum of structural abnormalities in SALD. A striking finding was that air trapping/hypoperfusion was an important component of SALD, in addition to inflammation/infection (including bronchiectasis). Differences in the disease spectrum may have implications for prognosis and treatment of patients with CF who have SALD. Our next step will be to link the SALD scores to clinical outcome, to determine the minimal important difference of changes in the component scores.
Acknowledgments
We would like to acknowledge Ivan Macciocca, genetic counsellor in Genetic Health Services Victoria, Australia for contributing information on CF DNA mutations in patients from the Alfred Hospital. Furthermore, we would like to thank Linda Everse, for her valuable comments on the manuscript.
REFERENCES
Supplementary materials
Web only appendix for 64;10:876
Files in this Data Supplement:
Footnotes
Funding This study was supported by grants from the Sophia CF research fund; the CF Trust of the Royal Children’s Hospital, Melbourne, Australia; the Dutch Cystic Fibrosis Foundation (NCFS); and the Italian CF Fund (IERFC). None of the sponsors was involved in the study design, data collection, analysis, interpretation of data, writing of the report, or in the decision to submit the paper for publication.
Competing interests None.
Provenance and Peer review Not commissioned; externally peer reviewed.
Ethics approval The review boards of all three participating centres approved the study protocol and waived informed consent.
▸ Additional figures, details of patients and methods are published online only at http://thorax.bmj.com/content/vol64/issue10
Linked Articles
- Airwaves