Article Text

Abstract
BACKGROUND Asthma has been described as an eosinophilic bronchitis driven by interleukin(IL)-4 and IL-5. The quantification of cytokine mRNA levels in airway samples has been confounded by housekeeping gene expression which differs between and within asthmatics and controls.
METHODS The usefulness of competitive reverse transcriptase-polymerase chain reaction (RT-PCR) that is independent of housekeeping gene expression for quantitating the mRNA for interferon (IFN)γ, IL-2, IL-5, IL-4 and its receptor antagonist encoding splicing variant IL-4δ2 was determined in a cross sectional study of 45 normal control subjects and 111 with asthma.
RESULTS Atopic controls and atopic asthmatic subjects expressed more IL-5 than non-atopic controls (p<0.02) in bronchoalveolar lavage (BAL) cells, but not in biopsy specimens. IL-5 mRNA expression in BAL cells from asthmatic subjects using inhaled corticosteroids (ICS) was significantly lower than those not receiving ICS (p=0.04). IL-2 mRNA levels differed with steroid use in biopsy specimens but not in BAL cells. IFNγ, IL-4, and IL-4δ2 mRNA levels did not differ between any groups and were not affected by steroid use. IL-4 and IL-4δ2 mRNA levels were positively correlated (p<0.0001), suggesting coordinated transcription.
CONCLUSIONS While the signal differentiation of competitive PCR in asthma may rival that of in situ hybridisation and immunohistochemistry, the method is expensive and wasteful of material.
- asthma
- competitive PCR
- interleukins
Statistics from Altmetric.com
Asthma is characterised pathologically by an infiltrate of activated T cells and eosinophils into the airways.1 ,2Helper T (Th) cells can be broadly divided into two functional subsets based on their profile of cytokine production: type 1 T cells (Th1) predominantly produce interferon (IFN)γ and promote delayed type hypersensitivity, while type 2 T cells (Th2) secrete interleukin (IL)-5 and IL-4 and regulate B cell and eosinophil mediated responses. IL-2 is recognised as the principal T cell growth factor and is produced by both classes of Th cells in humans.3
A number of studies of endobronchial biopsy and bronchoalveolar lavage (BAL) specimens have shown a predominance of IL-4 and IL-5 gene expression in asthma and atopy.2 ,4-7 However, the quantitation of IL-4 gene expression in these studies is likely to have been confounded by the unrealised co-detection of the IL-4 alternative splice variant, IL-4δ2.8
The use of polymerase chain reaction (PCR) technology in asthma has usually been characterised by qualitative assessments9-11or, at best, semiquantitative assays dependent on “normalisation” by comparison with housekeeping gene expression.6 ,12Beta-actin, a cytoskeletal protein, and GAPDH, an enzyme of glycolysis, are the two most widely used housekeeping genes,13 based on rather anecdotal evidence of their consistency of expression. We have recently used a reverse transcription (RT) competitive PCR method to directly quantitate β-actin and GAPDH mRNA levels in a cross sectional series of normal control and asthmatic airway biopsy specimens and BAL cells. Asthmatic subjects not using inhaled corticosteroids (ICS) were found to express up to 10 times less GAPDH and β-actin mRNA than asthmatic subjects using ICS or normal controls (unpublished data). It is likely that uncritical use of such housekeeping genes for normalising data has led to false confidence in previous semiquantitative data.
In this cross sectional study we have used similar competitive PCR assays to quantitate IL-5, IL-4, IL-4δ2, IL-2, and IFNγ in BAL cells and airway biopsy specimens without the need for normalisation by housekeeping gene expression with its potential for confounding.
Methods
SUBJECTS
One hundred and eleven asthmatic volunteers took part in the study. Airway endobronchial biopsy specimens were obtained from 80 subjects and BAL cells from 89 (table 1). BAL cells were obtained from a number of subjects from which biopsy specimens were not available and vice versa, hence the total number of asthmatics in the study was 111 rather than closer to 89. Asthmatic subjects fulfilled the American Thoracic Society criteria for asthma14 with documented airway reversibility to inhaled bronchodilators and increased responsiveness to methacholine. They all used albuterol for relief of symptoms as needed, with 93 patients using regular ICS. Salmeterol (50 μg twice daily) was used by 12 patients from whom BAL cells were obtained and in five of those from whom biopsy specimens were taken. No patient was taking any other anti-asthma medication. Volunteers who had suffered from acute respiratory tract infection during the previous 4 weeks, who had any change in asthma medication, or had been admitted to hospital with airway disease in the 4 weeks before the study were excluded.
Characteristics of subjects undergoing bronchoscopy
Forty five normal volunteer control subjects were also recruited. They had no history of asthma or other respiratory diseases, were using no medication, had no bronchodilator response to albuterol, and a negative challenge test to 3.2 mg inhaled methacholine. All asthmatic and control subjects were non-smokers and gave informed written consent before commencing the study, which was approved by the Alfred Hospital ethics committee.
Atopic status was assessed by skin prick testing to a panel of seven common aeroallergens and was defined by a response of ⩾3 mm diameter to one or more of them. Forced expiratory volume in one second (FEV1) and bronchial responsiveness to methacholine were measured in the morning and after a period of at least 8 hours without bronchodilators (24 hours for long acting β agonists). A rolling seal spirometer (SensorMedics Corporation, Yorba Linda, CA, USA) was used for measurement of FEV1 according to American Thoracic Society guidelines. Bronchial responsiveness to methacholine was assessed by a previously established dosimeter technique15and expressed as the cumulative dose required to provoke a 20% decrease in FEV1 (PD20) using linear interpolation from a dose-response plot.
BRONCHOSCOPY
Bronchoscopy was performed within 2 days of methacholine challenge. Subjects were premedicated with 0.4 mg intravenous atropine and 5–15 mg midazolam. Inhaled albuterol (200 μg) was given to all subjects 15 minutes before bronchoscopy. Lignocaine spray (4%) was applied to the pharynx and larynx and 2% lignocaine was administered below the vocal cords in 2 ml aliquots as required up to a maximum dose of 6 ml. Subjects were monitored using pulse oximetry and oxygen was administered at 4 l/min during the procedure. BAL of the right middle lobe was performed by instilling three aliquots of 60 ml phosphate buffered saline with immediate aspiration into siliconised glass containers. Endobronchial biopsy specimens were taken from the segmental subcarinae of the right lower lobe of each patient using alligator forceps (Olympus, Tokyo, Japan). Samples were transported on ice to the laboratory and two biopsy specimens were snap frozen in liquid nitrogen within 15 minutes and stored at –80°C. BAL cells in aliquots of 1–4 × 10⁶ cells were rapidly pelleted by centrifugation at 1200 rpm for 15 minutes, snap frozen, and stored at –80°C.
RNA EXTRACTION
RNA from BAL cells and endobronchial biopsy specimens were extracted with RNeasy total RNA kit (Qiagen, Hilden, Germany). Tissue was homogenised in 700 μl lysis buffer RLT using a Polytron rotor-stator (Kinematica, Luzern, Switzerland) followed by aspiration 10 times through a 21 gauge syringe needle to shear chromosomal DNA. Cell pellets were resuspended in 700 μl lysis buffer RLT by aspiration 10 times through a 21 gauge syringe needle. RNA was eluted from spin columns with 40 μl diethylpyrocarbonate treated water. Aliquots of 4 μl of RNA were quantitated by capillary spectrophotometry using an absorbance capillary adaptor cell (Helix, San Diego, USA) and a Cary 1 spectrophotometer (Varian, Melbourne, VIC, Australia) with background correction at 320 nm. Samples with (A260–A320)/(A280–A320) ratios less than 1.7 and/or yields less than 0.5 μg total RNA were excluded from subsequent analysis. BAL cells gave a success rate of 90% with a yield of 2.9 μg (range 0.6–12.2) while biopsy specimens were extracted with a success rate of 70% and a median yield of 1.0 μg (range 0.5–6.5).
COMPETITOR TEMPLATES AND PRIMERS
An IL-5 competitor was synthesised by PCR mediated mutagenesis as previously described.16 The 42 base composite primer (table 2) was used with the lower IL-5 primer in 30 cycles of PCR with 250 ng of human chorionic male DNA as the template. The PCR product was diluted 1:30 and 2 μl aliquots were amplified in five secondary reactions as for samples for 35 cycles. The resulting PCR product was purified by phenol-chloroform extraction and ethanol precipitation.17
Details of primers used
DNA competitor templates for IL-4 and IFNγ PCR were obtained from Clontech (Palo Alto, CA, USA). IL-2 PCR used a synthetic mRNA competitor, pAW109 cRNA (Perkin-Elmer, Foster City, CA, USA). Primers (synthesised by GeneWorks, Adelaide, SA, Australia) were redesigned using oligo 5.0 primer analysis software (National Biosciences, Plymouth, MN, USA) to improve their specificity and annealing profiles (table 2). All competitors were diluted to working concentrations with 50 μg/ml nuclease-free glycogen (Roche Diagnostics Australia, Castle Hill, NSW, Australia) in 10 mM Tris HCl, pH 7.5.
VALIDATION OF COMPETITIVE PCR
The simultaneous quantitation of IL-4 and IL-4δ2 by dual mRNA species competitive PCR was conducted as previously.8 To establish that mRNA and competitor templates amplify equally, a “changing input-output ratio” series of reactions was set up for each gene. To test the validity of IL-2 RT-PCR, a serial titration of pAW109 cRNA from 2 × 10³ to 5.12 × 10⁵copies per reaction was established in 15 μl cDNA synthesis reactions containing 180 ng phytohaemagglutinin (PHA) stimulated peripheral blood mononuclear cell (PBMC) RNA.17Aliquots of 2 μl cDNA were added to 100 μl PCRs which were then split into duplicates and amplified for 35 and 40 cycles. For IL-5 competitive PCR the competitor was titrated in twofold steps from 5.12 × 10⁴ copies to 200 copies against PHA stimulated PBMC cDNA and duplicate reactions were amplified for 35 and 40 cycles. IFNγ competitive PCR was similarly tested, titrating from 8 × 10⁴ copies to 3.13 × 10² copies competitor and amplifying for 30 and 35 cycles.
REVERSE TRANSCRIPTION AND COMPETITIVE PCR
cDNA was synthesised from 0.27–3.86 μg RNA (mean 0.95 and 2.03 μg for biopsy specimens and BAL cells, respectively) in a volume of 57 μl consisting of 1 × GeneAmp PCR buffer, 5 mM MgCl2, 1 mM deoxyribonucleotide triphosphate, 0.8 U/μl RNase inhibitor, 2 μM oligo d(T)16 and 2 U/μl MuLV reverse transcriptase (all from Perkin-Elmer). For cDNA synthesis from BAL cell RNA, 3 × 10⁵ copies of pAW109 cRNA was added to each reaction while, for biopsy RNA, 4 × 10³ copies of pAW109 RNA was used. Reactions were incubated for 1 minute at 15°C and then the temperature was increased to 42°C over 9 minutes followed by 1 hour at 42°C, 5 minutes at 85°C and 1 minute at 4°C.
For IL-4 and IL-5 competitive PCR, 20 μl of cDNA was added to a 100 μl reaction consisting of 2 U AmpliTaq Gold, 1 × GeneAmp PCR buffer, 1.5 mM MgCl2, 200 μM deoxyribonucleotide triphosphate (all from Perkin-Elmer), 0.2 μM upper and lower primers, and 40 copies of competitor. Thermal cycling was conducted in an MJ Research PTC-200 (Watertown, MA, USA) with the temperature profile commencing with an initial denaturation of 8 minutes at 94°C followed by 50 cycles of 94°C for 1 minute, annealing temperature (table 2) for 1 minute, and 72°C for 1 minute, concluding with 7 minutes at 72°C and 1 minute at 4°C. IL-2 and IFNγ PCR was conducted in 50 μl reactions as above except that 5 μl and 3 μl of cDNA, respectively, and 45 cycles of amplification were used. For IFNγ PCR of BAL cDNA 600 copies of competitor was used, while 200 copies were used with biopsy cDNA.
The PCR products were resolved by electrophoresis through 1.5 mm 4% 19:1 PAGE gels (acrylamide:bisacrylamide; Bio-Rad Laboratories, Hercules, CA, USA) in 2 × TAE17 using active cooling to maintain the temperature at 16–18°C. PAGE gels were stained by overlay with 1:10 000 SYBR Green I (Molecular Probes, Eugene, OR, USA) in 2 × TAE for 45 minutes and then scanned directly in a laser based fluorescence scanner (FluorImager 575, Molecular Dynamics, Sunnyvale, CA, USA). PCR product band volumes were quantitated with ImageQuaNT software (Molecular Dynamics). Native:competitor product ratios were calculated and the levels of gene expression reported as copies of mRNA per μg total RNA.
STATISTICAL ANALYSIS
The differences between atopic and non-atopic asthmatics and controls were analysed using a generalised linear model with an interaction between atopy and asthma being fitted to the model. Similarly, other interaction terms such as ICS usage were fitted where necessary. Age, sex, use of long acting β2 agonists, and RT-PCR batch factors were included in all models as potential confounding variables and then post hoc comparisons were made between groups after fitting the overall model. The results are presented as least squares mean (SE) values with differences between groups calculated in the order written. Given that some outcome variables followed a log-normal distribution, the relevant data were calculated as loge so these comparisons are presented as ratios with 95% confidence intervals (CI) rather than differences. The Pearson correlation was used to test associations between IL-4 and IL-4δ2 and the Mann-Whitney U test was used for intergroup comparisons for IL-4/β-actin ratios. Statistical analyses were performed using SAS version 6.12 software (SAS institute, Cary, NC, USA).18
Results
VALIDATION OF COMPETITIVE PCR
Titration of IL-5 (fig 1) and IFNγ (data not shown) competitors against standard aliquots of PHA stimulated PBMC cDNA in changing ratio experiments showed that, in each case, the ratios followed the predicted line. Similarly, serial titration of the IL-2 competitor pAW109 cRNA against PHA stimulated PBMC RNA followed by subsequent RT-PCR produced output ratios closely in proportion to the input ratios. Thus, IL-5, IFNγ, and IL-2 PCR products competed with their respective competitor templates with consistent efficiencies irrespective of their input ratio, allowing the input copies of mRNA to be calculated. Similar data for IL-4 and IL-4δ2 have been published previously.8
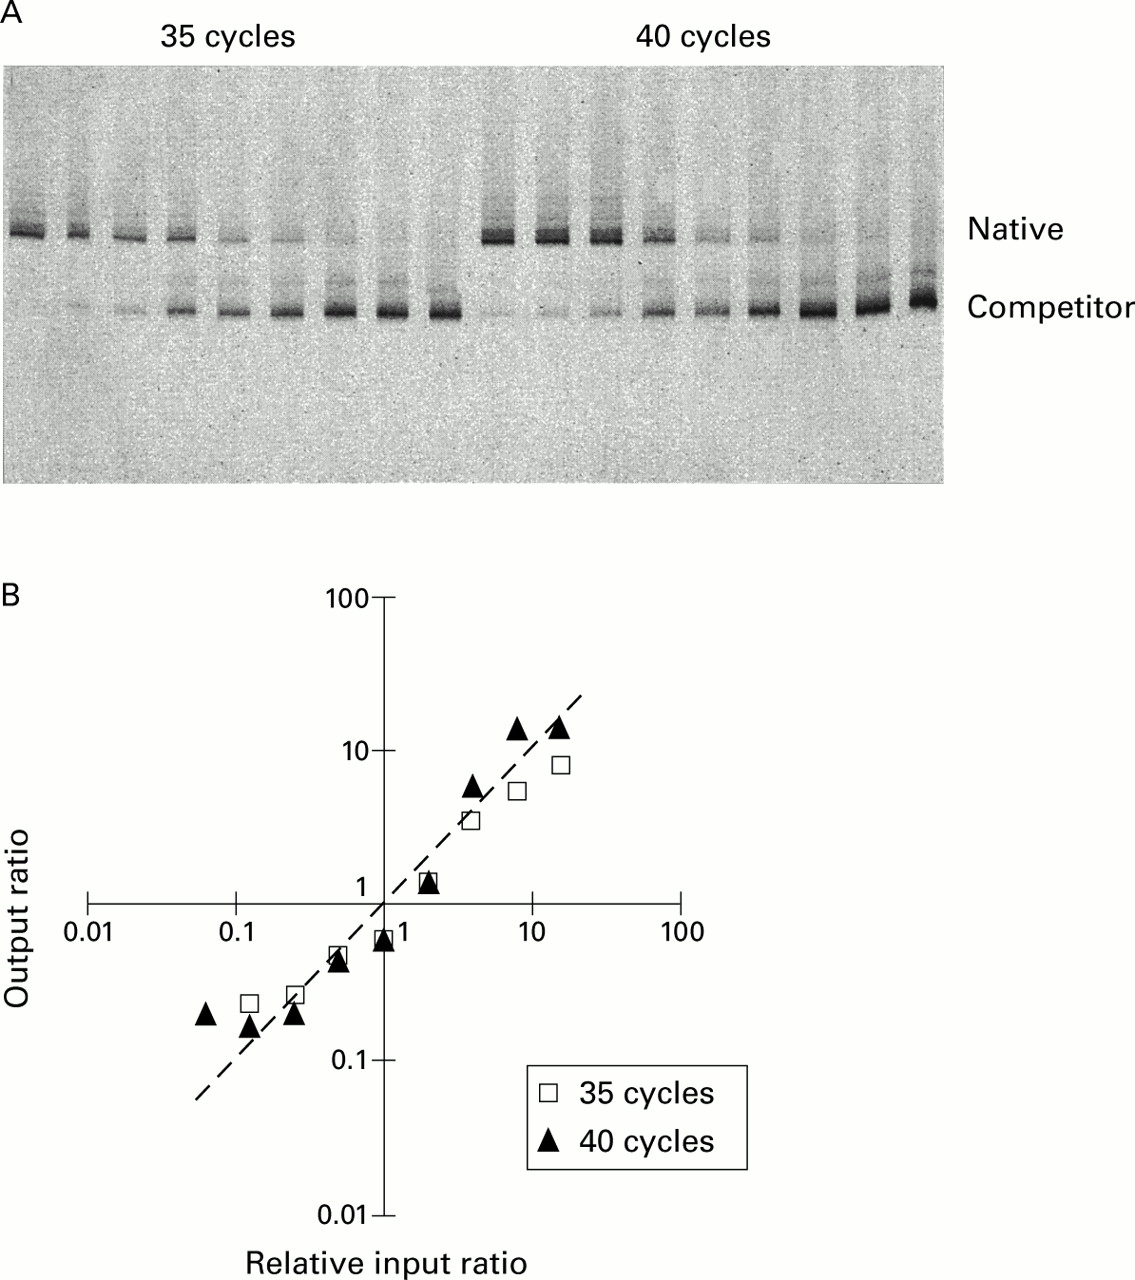
Test of amplification efficiency of IL-5 competitive PCR by titration of competitor. (A) PAGE of IL-5 competitive PCR demonstrating a changing input ratio series with increasing amount of competitor left to right. (B) The output native/competitor ratios of each series are plotted against input ratios relative to the one or two output ratios closest to 1. The actual data lay close to the line of prediction where output ratios equal input ratios. The line of prediction is indicated by a dashed line with a slope of 1.
ASTHMA, ATOPY AND TH CYTOKINE EXPRESSION IN BAL CELLS AND BIOPSY SAMPLES
No cross sectional differences in IL-5 mRNA levels were observed in biopsy samples (fig 2C). In BAL cells the only signal for IL-5 was an increase in atopic subjects with non-atopic asthmatics being intermediate but not significantly different from any other group (fig2A). Thus, in normal control BAL cell RNA samples, IL-5 mRNA levels were higher in atopic subjects (least squares mean (SE) 1.5 (1.0) × 102 copies/μg RNA) than in non-atopic subjects (6.0 (2.6) × 101 copies/μg RNA, difference ratio 2.4, 95% CI of ratio 1.2 to 5.1, p=0.017). While levels of IL-5 in subjects with atopic asthma (1.4 (0.3) × 102 copies/μg RNA, difference ratio 2.4, 95% CI of ratio 1.2 to 4.8, p=0.012) were significantly higher than in non-atopic controls, they were not different from atopic controls or subjects with non-atopic asthma (1.1 (0.3) × 102 copies/μg RNA).
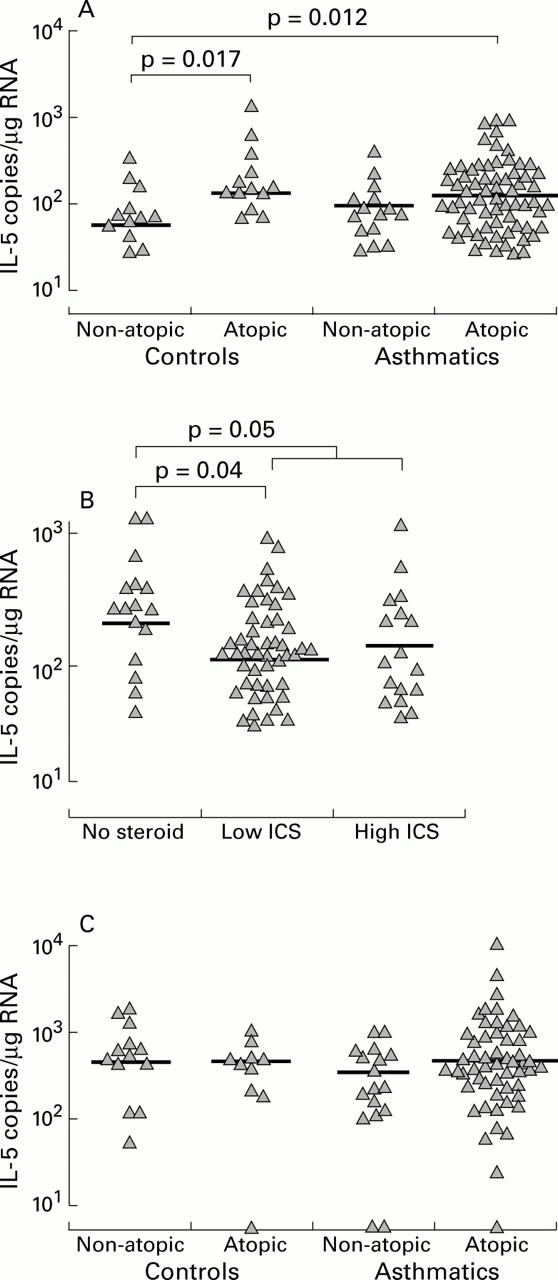
IL-5 gene expression related to atopy, asthma, and use of inhaled corticosteroids (ICS). IL-5 mRNA levels were increased with atopy (A) and decreased with ICS use (B) in BAL cells but not in biopsy samples (C). As a group the asthmatic subjects were not different from controls.
BAL cells from asthmatic subjects not using ICS expressed more IL-5 mRNA than those using ICS (1.9 (0.7) × 102 v 1.0 (0.2) × 102 copies/μg RNA, difference ratio 1.9, 95% CI of ratio 1.0 to 3.5, p=0.05), but there was no obvious dose response effect (fig 2B).
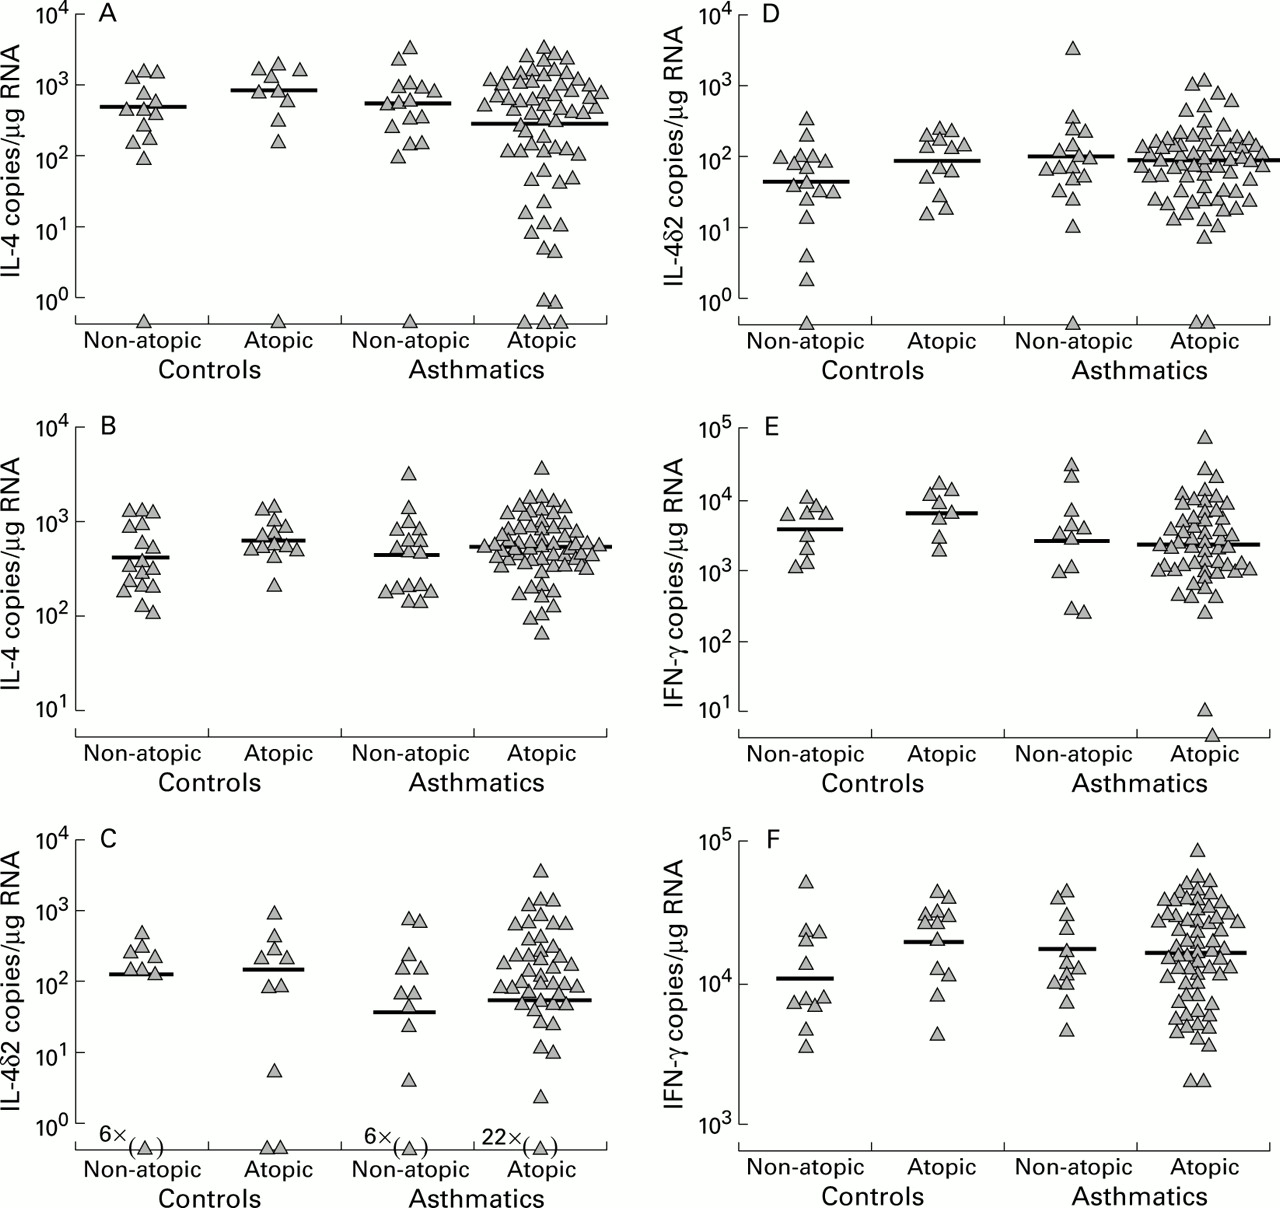
Neither in BAL cells nor biopsy specimens did IL-4, IL-4δ2, or IFNγ mRNA levels differ with atopic status or asthma (fig 3). Furthermore, there was no difference between asthmatic subjects using ICS and those not receiving ICS treatment.

Cross sectional analyses in biopsy specimens (A, C, E) and BAL cells (B, D, F) of (A, B) IL-4, (C, D) IL-4δ2, and (E, F) IFNγ mRNA levels.
IL-2 gene expression in biopsy specimens did not differ significantly between controls and asthmatic subjects not using ICS (1.3 (0.6) × 104 v 2.7 (2.9) × 104 copies/μg RNA; fig 4A). However, biopsy specimens from asthmatic subjects using up to 500 μg/day of ICS (3.5 (0.4) × 103 copies/μg RNA, difference ratio 0.13, 95% CI of ratio 0.02 to 0.92, p=0.042) and those using 500–1500 μg/day ICS (2.0 (0.3) × 103 copies/μg RNA, difference ratio 0.07, 95% CI of ratio 0.01 to 0.57, p=0.014) expressed less IL-2 mRNA than asthmatic subjects not receiving treatment with ICS. In common with IFNγ and IL-4 gene expression, IL-2 mRNA levels did not vary with atopy. No differences were detected in IL-2 mRNA expression in BAL cells (fig 4B).

IL-2 gene expression, asthma, and use of inhaled corticosteroids (ICS) in (A) biopsy specimens and (B) BAL cells.
EVIDENCE OF COORDINATED EXPRESSION OF IL-4 AND IL-4δ2
Pearson regression analysis indicated that IL-4 and IL-4δ2 mRNA levels were positively correlated in both BAL cells (r 2=0.53, p<0.0001, n=111) and biopsy specimens (r 2=0.31, p<0.0001, n=65; fig 5). In most of the samples IL-4 mRNA levels were higher than IL-4δ2 and the slope of the regression curve was 3.1 and 13.4 for biopsy specimens and BAL cells, respectively.
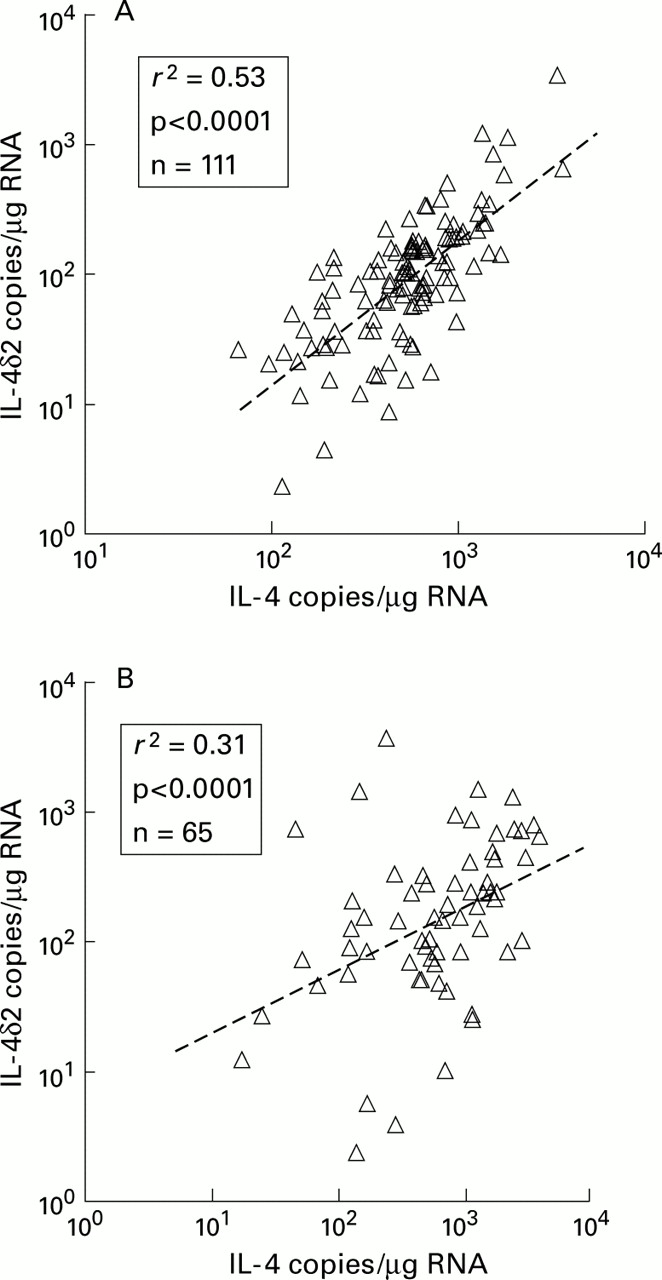
Pearson correlations between IL-4 and IL-4δ2 in (A) BAL cells and (B) biopsy specimens indicating a degree of coordinated expression of IL-4 mRNA and its splicing variant, IL-4δ2.
EFFECT OF USING HOUSEKEEPING GENE EXPRESSION FOR NORMALISATION
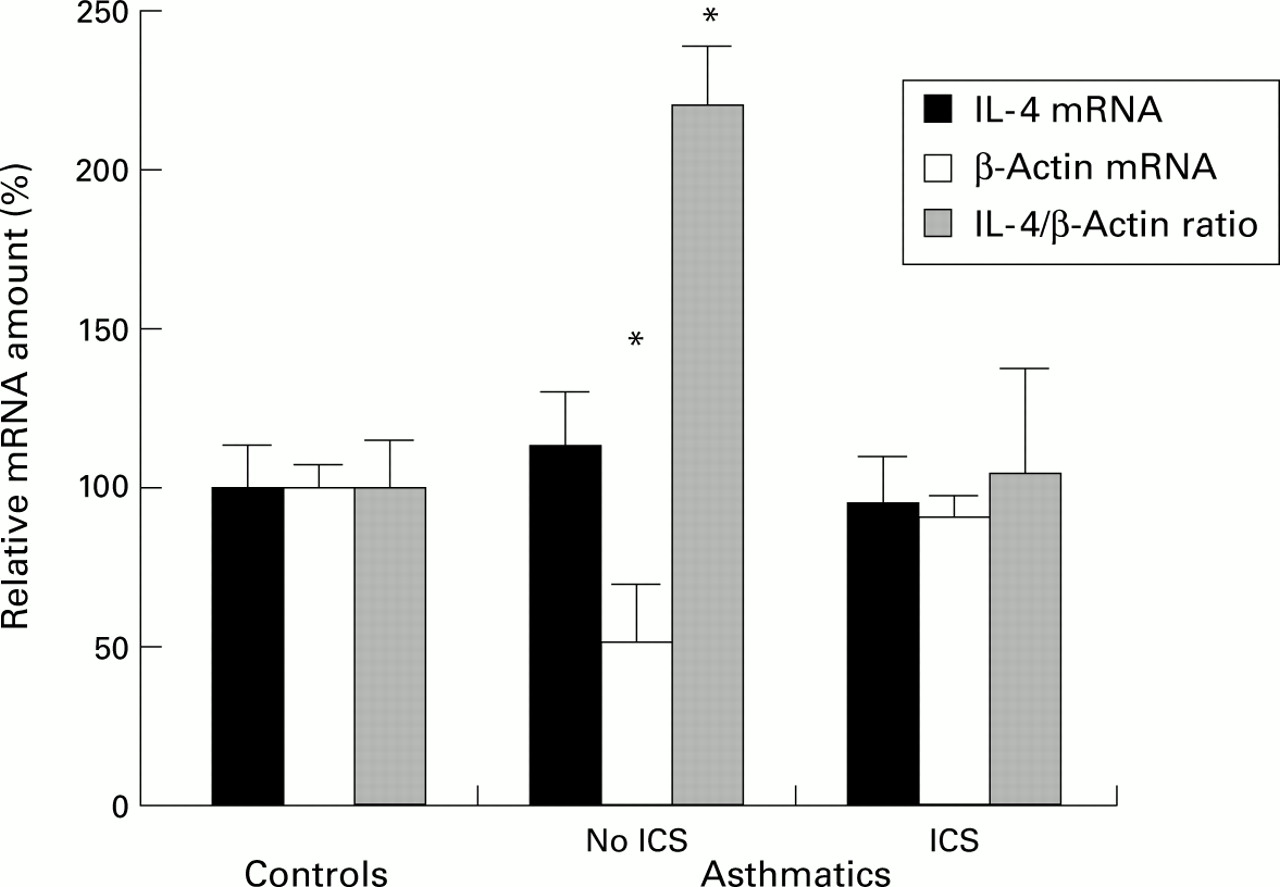
To demonstrate the potential for confounding by use of housekeeping gene mRNA levels as denominators of mRNA expression for genes of interest, β-actin competitive PCR was conducted on BAL cell RNA using the same cDNA reaction. While IL-4 gene expression assessed directly did not differ with asthma or atopy, significant differences were seen when IL-4 mRNA levels were expressed as a ratio (“normalised”) with β-actin, with asthmatics not using ICS (17.6 (3.3) × 10–6) having a higher ratio than normal controls (8.0 (1.2) × 10–6, median difference 11.1 × 10⁻⁶, 95% CI 5.5 to 17.4 × 10⁻⁶, p=0.0007) and asthmatic subjects using ICS (8.4 (2.7) × 10–6, median difference 10.6 × 10⁻⁶, 95% CI 6.3 to 16.6 × 10⁻⁶, p=0.0003; fig 6). Thus, apparent differences in the IL-4/β-actin ratios are confounded by the differences in β-actin mRNA levels between the groups.

Effect of using β-actin to normalise IL-4 mRNA levels in BAL cells. To compare IL-4 and β-actin mRNA levels and their ratios the least square mean (SE) values are presented as percentages of the respective normal control least squares mean in each group of subjects. Significant differences were observed for β-actin and IL-4/β-actin ratios, with asthmatic subjects not using inhaled corticosteroids (ICS) being significantly different from normal controls and asthmatic subjects using ICS. *p<0.001.
Discussion
This study is the first to use quantitative competitive PCR methodology to measure Th cell cytokines in a cross sectional analysis of airway samples from asthmatic and normal control subjects. We believe these are also the first data not to be confounded by changes in housekeeping gene expression which we have confirmed to be a real potential problem in such airway samples. We found that, in BAL cells, atopic controls and atopic asthmatic subjects expressed more IL-5 than non-atopic controls, with non-atopic asthmatic subjects having intermediate levels. Within the asthmatic subjects there was an inhibitory effect of ICS on IL-5 mRNA levels in BAL cells. However, in biopsy specimens no cross sectional differences in IL-5 were detectable. Similarly, BAL cell and biopsy levels of IL-4, IL-4δ2, and IFNγ did not differ significantly with atopy, asthma, or ICS use. In contrast, IL-2 gene expression in biopsy samples but not in BAL cells was decreased with ICS use. Strong correlations between IL-4 and IL-4δ2 in both BAL cells and biopsy samples suggest a degree of coordinated expression, above a threshold of IL-4 production.
The use of a combination of an RNA competitor for IL-2 competitive RT-PCR and DNA competitors for RT followed by competitive PCR allowed all PCR assays to be conducted from a single RT reaction containing both sample RNA and IL-2 cRNA competitor. The RT competitive PCR assays in our recent study of β-actin and GAPDH gene expression in asthma were also conducted from this single cDNA synthesis reaction. A number of reviewers of competitive PCR technology have recommended the use of RNA competitors to control both cDNA synthesis and PCR steps.19 ,20 Multiple competitive reactions per sample, usually titrating the competitor against constant aliquots of sample,21 are increasingly being used to improve the variability and resolution of the method. The low yield of RNA from airway samples, particularly from biopsy specimens, necessitates efficient use of sample RNA and precludes the use of multiple RT and/or PCR reactions per mRNA level determination.
Capillary spectrophotometry allowed the amount of RNA to be used as the denominator between samples in this study rather than resorting to the use of housekeeping gene expression. In our study of housekeeping gene expression both β-actin and GAPDH mRNA levels were shown to be significantly lower in asthmatic subjects not using ICS than in those using ICS and normal controls. We have now confirmed the problem of confounding by showing that IL-4 mRNA levels expressed as ratios with β-actin give artefactual differences between the groups. The most extensive studies to date of T cell cytokines in asthma have been semiquantitative in that they have used external standard curve fitting in conjunction with normalisation of housekeeping gene expression.6 ,22-24 Since housekeeping gene expression is the ultimate denominator between samples in these studies, the results are very likely to be confounded by differences in housekeeping expression.
We used multivariant linear modelling statistics to control for confounding effects while testing the significance of other factors. This included correction for differences between groups attributable to atopy while, for example, testing the difference due to ICS use. While RNA samples were stratified by RNA concentration to facilitate cDNA synthesis and avoid systematic bias, we found that batch parameters were significant confounders, although differing batches were random between assays and not associated with the amount of input sample RNA. Likely causes include pipetting inaccuracies leading to differences in competitor amounts and differences in gel resolution, quality and staining influencing the measurement of native and competitor PCR products. Although multivariant statistics optimise power of such studies and allow a degree of correction for the methodological weakness, it is obviously important to avoid systematic biases where possible and, in particular, to minimise the number and differences between batches.
Despite the quantitative nature of our competitive PCR assays, we were only able to detect minor differences in cytokine gene expression with atopy, asthma, and ICS use. In the BAL fluid samples there were no significant differences between subject groups in the percentages of eosinophils, macrophages, or lymphocytes (data not shown). The asthmatic subjects in this study were clinically stable but had a wide range of bronchial hyperreactivity and dose of ICS needed, although current activity of the disease in terms of symptom levels was comparable between subjects. However, the results are cross sectional only and the absence of longitudinal PCR based studies of asthma in the literature is testament to the difficulties associated with such studies.
PCR assays commence with cell homogenisation and as a strategy are good for detecting large numbers of cells expressing small amounts of mRNA, but are relatively poor at detecting small numbers of upregulated cells producing larger amounts of message which become diluted with lysis. In situ hybridisation studies indicate that the latter pattern of expression is likely in asthma.4 ,6 ,7 A major problem with the application of quantitative PCR to asthma is the low levels of mRNA assayed, with some mean levels in this study being below 100 copies per μg total RNA. The pathological variability of the stable asthmatic subjects in this study is reflected in their mRNA levels and contributed to the lack of contrast between stable asthmatic and normal control subjects.
Our earlier study of IL-4 and its receptor antagonist encoding splicing variant, IL-4δ2,8 together with the new data presented here, indicate that both IL-4 mRNA variants are commonly expressed in lung samples. The primers used in this study to amplify IL-2 mRNA do not amplify the splicing variants IL-2δ2 or IL-2δ3 which also encode receptor antagonists.25 Given the difficulty of distinguishing cytokine splicing variants and, in particular, the absence of antibodies of confirmed specificity, previous studies are likely to be further confounded by co-detection.4 ,7 ,26
The strongest evidence that increased IL-4 and IL-5 expression is associated with asthma comes from airway allergen challenge in atopic patients. IL-510 ,27-30 and IL-427 ,28 gene transcription was reported to be upregulated 18–24 hours after challenge compared with that found immediately after challenge or compared with vehicle only challenge sites. Interestingly, not all studies found significant increases in IL-4 gene expression, even with acute allergen challenge.29 ,30 IL-4 and IL-5 have been correlated with asthma symptoms31 and may be more important in acute asthma than in stable asthma. The inconsistency of antigen challenge studies suggests that repeat antigen stimulation (both natural and introduced) may be required to obtain uniform upregulation of IL-4 and IL-5 in airway tissue. The expression of IL-2 and IFNγ was not changed by allergen challenge in the lung.27-30 In our group of stable non-acutely challenged asthmatics we did not find significant increases in IL-4, IL-4δ2, IL-2, or IFN-γ mRNA levels compared with normal controls. Differences in IL-5 gene expression related to atopy rather than to asthma were detected in BAL cells but not in biopsy specimens.
In our earlier study of IL-4 and IL-4δ2 in nine asthmatic and seven control subjects we also found no differences in absolute levels of mRNA but the asthmatic subjects were more likely to express IL-4δ2.8 With larger numbers of samples we were unable to repeat this earlier observation, possibly because the more heterogeneous range of patients in the current study may have masked the effect, if it truly exists. However, we did find that there was a strong positive correlation between IL-4 and IL-4δ2, but with IL-4 expression predominating over IL-4δ2, in both BAL cells and biopsy specimens. This is strongly suggestive of coordinated expression of IL-4 and its receptor antagonist encoding splicing variant. It is conceivable that splicing of IL-4δ2 may commence after a threshold of IL-4 expression is reached, allowing IL-4δ2 to act as a brake on IL-4 mediated responses. However, expression of mRNA does not necessarily mean that it is translated into protein or that the protein will be secreted. There is considerable overlap in the function of IL-4 and IL-13, mediated in part by shared receptors and receptor chains. Their close linkage on chromosome 5 and common promoter sequences mediate co-regulation.32 The co-expression of IL-4 and IL-4δ2 mRNA adds further strength to the concept that the balance of IL-4, IL-4δ2, and IL-13 and their receptors modulates IL-4 mediated responses.8 However, we did not measure IL-13 mRNA levels in this study.
The major purpose of this study was to perform a definitive evaluation of the usefulness of using quantitative competitive PCR in asthma research, mainly because previous PCR based studies have been so methodologically inadequate. The recent advent of real time quantitation of PCR has greatly simplified RT-PCR quantitation33 but the technology still needs to be evaluated carefully in lung samples, particularly with respect to the use of denominators such as housekeeping gene expression. The reality is that RT-PCR methodology is expensive, wasteful of material, and variable between samples. Even so, signals can be picked up but, in our experience, with little if any greater sensitivity than immunohistochemistry or in situ hybridisation methods.
Acknowledgments
The authors thank Ros Bish, Sally Gollant, Dr Frank Thien, Dr Xun Li, and Dr David Reid for their clinical assistance and Bernadette Orsida, Tiffany Bamford, Michael Pais and Bryce Feltis for sample reception. This work was supported by grants from the National Health and Medical Research Council and GlaxoWellcome Australia.