Article Text

Abstract
BACKGROUND Increased fractional exhaled NO concentrations (Feno) and blood/tissue eosinophilia are frequently reported in allergic children with mild asthma and are thought to reflect the intensity of the inflammation characterising the disease. The aim of this study was to investigate possible differences in Feno levels or in the intensity of the blood eosinophilia in allergic and non-allergic asthmatic children.
METHODS 112 children with stable, mild, intermittent asthma with a positive bronchial challenge to methacholine were consecutively enrolled in the study; 56 were skin prick test and RAST negative (non-sensitised) while 56 were sensitised to house dust mites (23 only to house dust mites (monosensitised) and 33 were sensitised to mites and at least another class of allergens (pollens, pet danders, or moulds)). Nineteen sex and age matched healthy children formed a control group.
RESULTS Compared with non-allergic patients, allergic children had a significantly higher rate of blood eosinophilia (p=0.0001) with no differences between mono- and polysensitised individuals. Forced expiratory volume in 1 second (FEV1), forced vital capacity (FVC), forced expiratory flow at 25–75% of vital capacity (FEF25–75%), and the degree of bronchial reactivity to methacholine were similar in non-atopic and atopic children, with no differences between mono- and polysensitised individuals. Feno levels measured by chemiluminescence analyser were higher in asthmatic children (15.9 (14.3) ppb) than in the control group (7.6 (1.6) ppb, p=0.04) and higher in allergic patients (23.9 (2.1) ppb) than in non-allergic patients (7.9 (0.8) ppb, p=0.0001), but there were no differences between mono- and polysensitised individuals (p>0.1). Significant correlations between blood eosinophilia and Feno levels were seen only in allergic (r=0.35, p<0.01) and in polysensitised individuals (r=0.45, p<0.05).
CONCLUSIONS In children with mild asthma, a similar degree of functional disease severity may be associated with a higher inflammatory component in allergic than in non-allergic subjects.
- airway inflammation
- bronchial hyperresponsiveness
- atopy
- asthma
- exhaled nitric oxide
Statistics from Altmetric.com
Bronchial asthma, even in its mild form, is characterised by local infiltration and activation of a variety of inflammatory and immunoeffector cells.1-3 The finding that eosinophils are toxic to human lung tissues4 and that their presence in the bronchial mucosa may correlate with morphological damage to the bronchial epithelium5 has strongly supported the hypothesis that these cells could play a role as major effector elements in the pathogenesis of asthma.6
The overall hypothesis is that, at least in allergic asthma, eosinophil accumulation is mediated by products released by T cells and mast cells.3 In addition, although adult atopic and non-atopic asthmatic subjects may have distinct patterns of T cell activation and cytokine production,7 ,8 similar levels of eosinophilic inflammation in the airways have been described in allergic and non-allergic asthma.9
The concept that airway inflammation may cause permanent airway remodelling and irreversible loss of pulmonary function10has suggested that, even in mild asthma, monitoring of airway inflammation may be useful for gauging the severity of the disease and the efficacy of anti-inflammatory treatment, and also to identify individuals (children and/or adults) who may need a closer follow up and, possibly, anti-inflammatory medication.11
Many attempts have been made to provide sensitive non-invasive markers to assess the presence and the intensity of airway inflammation in children. Measurements of several blood markers of inflammation have been proposed in the monitoring of asthma,12 ,13 but they are insufficiently sensitive since asthmatic inflammation is mainly confined to the airways. Assessment of airway inflammation can be obtained both invasively by bronchoalveolar lavage and bronchial biopsy and non-invasively by induced sputum2 ,14; however, these methods are not easily applicable on a routine basis, particularly in young children. The measurement of nitric oxide (NO) concentrations in exhaled air has recently been proposed as a non-invasive, simple, well tolerated test to assess airway inflammation in asthma, even in children.15-17 NO is generated froml-arginine by various cells in the airway including airway and alveolar epithelial cells, vascular endothelial cells, smooth muscle cells, and alveolar macrophages.17 The lungs of healthy human subjects produce low but detectable levels of NO, whereas asthmatic patients have increased levels of exhaled NO, probably in response to inflammatory stimuli such as cytokines.17 ,18Fractional exhaled NO concentrations (Feno) are increased in allergic children with mild allergic asthma and correlate with the degree of blood and airway eosinophilia.17 ,19
The present study was designed to investigate possible differences in Feno levels and blood eosinophilia in allergic and non-allergic subjects with stable, mild, intermittent asthma. Among the allergic population, monosensitised children—that is, individuals sensitised only to one class of allergens—and polysensitised children—that is, those sensitised to more than one class of allergens—were separately evaluated.
Methods
SUBJECTS
The study was performed in 112 children (47 girls and 65 boys) of mean (SD) age 10.9 (0.3) years (range 4–18) referred to our outpatient clinic with a history of mild asthma.20 All subjects had a positive response to a methacholine inhalation challenge and were characterised as atopic or non-atopic according to skin prick test reactions to common allergens (see below). Participating subjects were in a stable clinical condition and had not taken inhaled steroids at least in the year preceding the study. None of the study participants had reported upper or lower respiratory infection in the 2 months preceding the study. Children sensitised to pollens were evaluated out of the pollen season.
Nineteen sex and age matched healthy children of mean (SD) age 9.7 (1.3) years were evaluated as a control group. They had negative prick test reactions to the standardised skin prick test and normal IgE serum levels.
Parents or guardians of the children were informed of the scope of the study and of the procedures involved, and they gave their informed consent. The study protocol was approved by the hospital ethics committee. All the recruited children completed the study protocol.
SKIN PRICK TEST PROCEDURE
Sensitisation to the four most common classes of aeroallergens was evaluated by skin prick test.21 The allergen panels tested included: (a) house dust mite class (Dermatophagoides pteronyssinus 5000 PNU/ml and Dermatophagoides farinae 5000 PNU/ml); (b) pollen class (Parietaria officinalis1000 UP/ml, mix of Graminae 10 000 UP/ml, Compositae 10 000 UP/ml, Betulaceae 10 000 UP/ml, Oleaceae 10 000 UP/ml), (c) pet dander class (cat and dog skin scale allergen extracts 1:20), and (d) moulds (mix of Aspergillus 10 000 PNU/ml,Cladosporium 10 000 PNU/ml,Alternaria tenuis 10 000 PNU/ml; Bayropharm, Milan, Italy). A histamine solution in distilled water (10 mg/ml) and the glycerol buffer diluent of the allergen preparations were used as positive and negative controls, respectively. Each subject was skin tested in duplicate on the volar surface of the forearm using 1 mm prick lancets (Dome/Hollister-Stier, UK). On each visit skin prick tests were performed using the same panel of allergens. The tests were carried out by two specially trained nurses and the weal reaction was read by the same nurses under the supervision of a physician. The reactions were recorded within 15 minutes by evaluating the skin response rate to the inoculation of each allergen compared with the response in the negative control: a weal diameter 3 mm larger than the negative control was considered as a positive reaction.21 Antihistamines were stopped at least 3 weeks before skin testing.
BLOOD EOSINOPHIL COUNT EVALUATION
Eosinophil counts on peripheral blood samples were performed by Technicon H6000 (Technicon Instrument Corporation, Tarrytown, NY, USA), a system that automatically counts and differentiates leucocytes by an alkaline peroxidase method. Approximately 12 000 leucocytes were counted on each occasion. The coefficient of variation for eosinophil counts was 7.5%. Peripheral blood eosinophilia was evaluated both as the number and as percentage of cells, as previously described.12
PULMONARY FUNCTION AND BRONCHIAL HYPERRESPONSIVENESS
All children were able to perform forced expiratory manoeuvres. Forced vital capacity (FVC), forced expiratory volume in 1 second (FEV1), and forced expiratory flow at 25–75% of the vital capacity (FEF25–75%) were measured by spirometry (Med Graphics Pulmonary Function System 1070 series 2, Med Graphics Corporation, St Paul, MN, USA).17 On each occasion three forced expiratory manoeuvres were obtained and the best values were retained. All children had baseline FEV1 >80% of the predicted value.
Methacholine aerosols were delivered by an ampoule dosimeter device (MEFAR, Brescia, Italy); the same ampoule was used for each patient.22 Methacholine solution was made up freshly in 0.9% pyrogen-free saline solution on the day of use, and the methacholine challenge was started from a dose of 0.02 mg. The best of three FEV1 manoeuvres measured within 1 minute after inhalation of each methacholine dose was used to construct dose-response curves. The methacholine dose was doubled until FEV1 fell below 80% of the control value (inhalation of saline) or up to a maximal dose of 5 mg. The dose causing a 20% fall in FEV1 (PD20) was calculated by interpolation of the dose-response curves.22
DETECTION OF EXHALED NO
A chemiluminescence analyser (Logan LR 2000 System, Kent, UK) sensitive to NO concentrations from 2 to 5000 parts per billion (ppb, by volume) was used. The system was adapted for online measurement of NO and therefore did not require collection of exhaled air, a potential source of variable loss of reactive NO.17 Certified NO mixtures (100 ppb) in nitrogen (BOC Gases, Guildford, UK) were used for daily calibration. Environmental NO was measured before and after each study and never exceeded 15 ppb. After flushing the analyser with NO-free compressed air, the subjects were asked to perform a slow expiratory vital capacity manoeuvre over 10–15 seconds through a wide bore Teflon tube17 against a positive pressure of 6–8 cm H2O. During this manoeuvre the oropharyngeal pressure increases enough to cause closure of the soft palate, thereby minimising nasal NO contamination.17 Expiratory flow was maintained at 50 ml/s with the aid of visual feedback. Typically, the NO concentration peaks early during expiration, probably as a result of the contribution of nasal NO. This peak is followed by a plateau which is believed to represent NO from the lower respiratory tract. Mean plateau values were calculated for each exhalation. The highest value from three successive reproducible recordings obtained at 2 minute intervals was retained for statistical analysis. All measurements were made by two independent observers who were unaware of the patients' state of health. The repeatability of NO measurements in orally exhaled air was evaluated as proposed by Bland and Altman.23 For this purpose, two measurements taken at an interval of >1 hour on the same day between 08.30 and 10.00 hours in 12 children were compared. The mean difference in the NO concentration in air exhaled from the lungs between the two measurements was 0.38 (0.27) ppb (p>0.1). The coefficient of repeatability was 2.03 ppb.
STATISTICAL ANALYSIS
The number and percentage of eosinophils are reported as median with lower and upper quartiles (indicated in brackets), whereas all the other data are expressed as mean (SD). The Mann-Whitney U test was used when appropriate. Correlations were determined using Spearman's rank correlation coefficient. R(n) indicates ther value showing correlations between eosinophil numbers and Feno levels, whiler(%) indicates ther value showing correlations between eosinophil percentages and Feno levels. The χ2 test was used to compare the rates. The level of statistical significance was set at p<0.05.
Results
ALLERGIC SENSITISATION IN ALLERGIC AND NON-ALLERGIC CHILDREN
Of the 112 children enrolled in the study, 56 were non-allergic while 56 were sensitised at least to house dust mites. Twenty three allergic children (41.1%) were monosensitised—that is, sensitised only to house dust mites—while 33 (58.9%) were polysensitised—that is, sensitised to house dust mites and at least another class of allergens (pollens, pet danders, moulds).
Compared with non-allergic children, allergic children had a significantly higher degree of blood eosinophilia, both as a percentage (median difference 4.6%, 95% CI 3.2 to 5.9, p=0.0001) and as absolute numbers (median difference 375.0 cells/mm3, 95% CI 237.9 to 512.1, p=0.0001, table 1). No difference in blood eosinophilia was observed between mono- and polysensitised children (p>0.1).
Blood eosinophilia in allergic and non-allergic children
PULMONARY FUNCTION AND FENO LEVELS IN ALLERGIC AND NON-ALLERGIC CHILDREN
All the enrolled children were able to make satisfactory recordings of pulmonary function parameters and Feno. There were no significant differences in FEV1, FVC, and FEF25–75% values between non-allergic and allergic asthmatics, or between mono- and polysensitised individuals (p>0.1 for each comparison, table 2). Similarly, the degree of bronchial reactivity to methacholine was similar in non-atopic and in atopic children, with no differences between mono- and polysensitised individuals (p>0.1 for each comparison).
Pulmonary function parameters in allergic and non-allergic children
NO measurements showed that patients with asthma had higher Feno values than normal non-atopic children of comparable age (15.9 (14.3) ppb v 7.6 (1.6) ppb; mean difference 8.3 ppb, 95% CI 5.5 to 11.1, p=0.040; not shown). Higher Feno levels were found in allergic patients (23.8 (2.1) ppb) than in non-allergic patients (7.9 (0.8) ppb; mean difference 15.9 ppb, 95% CI 11.5 to 20.3, p=0.0001; fig 1). In addition, 46 of the 56 allergic children (82.1%) had raised Feno levels (higher than 10.8 ppb, that is, >2 standard deviations of the mean in healthy subjects), whereas only 12 of the 56 non-allergic children (21.4%) had increased Fenoconcentrations (χ2 = 38.94, 95% CI 6.06 to 48.65, p<0.0001). No significant difference in Feno levels was found between monosensitised and polysensitised children (25.8 (2.9) ppb and 24.3 (3.3) ppb, respectively, p=0.74; fig 1).
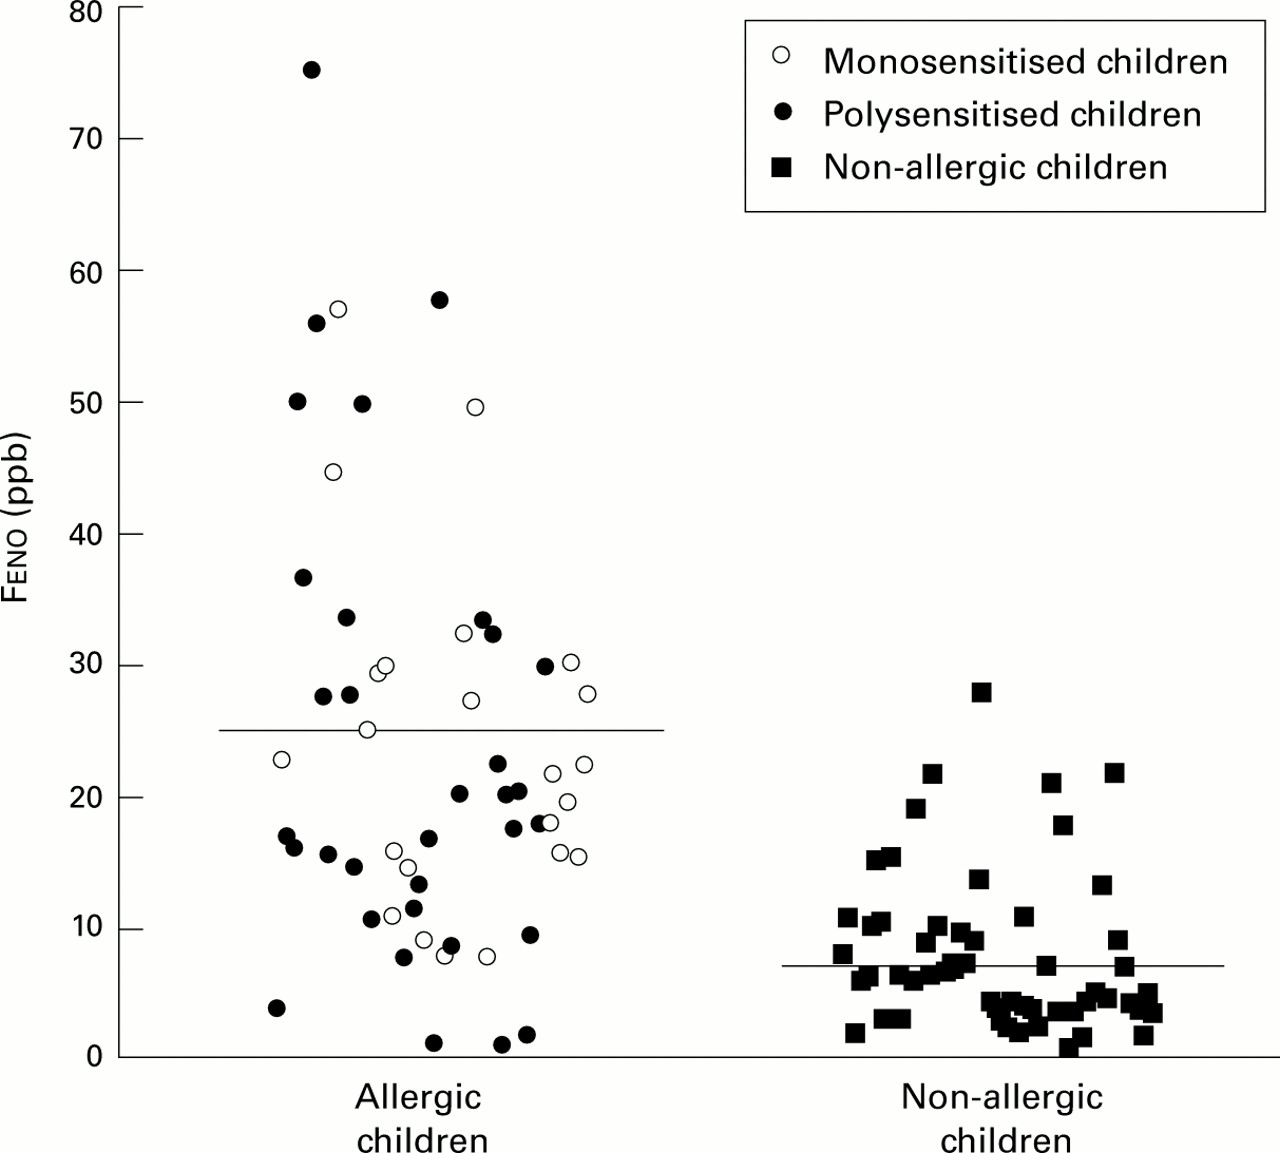
Fractional exhaled NO concentrations (Feno) in parts per billion (ppb) in monosensitised, polysensitised, and non-allergic children. The horizontal lines represent mean values in the allergic and non-allergic populations (p=0.0001).
CORRELATION BETWEEN FENO, BLOOD EOSINOPHILIA AND PULMONARY FUNCTION
When asthmatic children were analysed as a whole, a significant correlation was found between Feno levels and the percentage or number of blood eosinophils (r(%)=0.50, p=0.0001;r(n)=0.47, p=0.0001; respectively, fig 2). A high proportion (50.9%) of asthmatic children had increased Feno levels (⩾8.8 ppb) associated with an increased percentage of blood eosinophils (>3% white blood cells), whereas only 11.3% of asthmatic children had increased Feno levels (⩾8.8 ppb) and low levels of blood eosinophilia (⩽3% white blood cells), (χ2 = 15.67, 95% CI 2.31 to 16.37, p=0.00008). Similarly, 43.4% of asthmatic children had increased Fenolevels (⩾8.8 ppb) associated with an increased number of blood eosinophils (⩾300 cells/mm3), whereas only 18.9% of asthmatic children had increased Feno levels (⩾8.8 ppb) and low levels of blood eosinophilia (<300 cells/mm3), (χ2 = 9.29, 95% CI 1.55 to 9.59, p=0.0023). Evaluating the allergic and non-allergic populations separately, a significant correlation was found between blood eosinophilia and Fenolevels in the allergic group (r(%)=0.36, p=0.007; r(n)=0.35, p=0.010; fig 3) but not in the non-allergic group (r(%)=–0.20, p=0.157; r(n)= –0.21, p=0.152; not shown). Blood eosinophilia correlated with Feno levels in polysensitised (r(%)=0.43, p=0.016;r(n)=0.45, p=0.011) but not in monosensitised children (r(%)=0.22, p=0.296; r(n)=0.15, p=0.483; not shown). No correlations were found between Feno and FEV1, FEF25–75%, FVC, or PD20 methacholine (p>0.1 for each correlation, data not shown).

Relationship between fractional exhaled NO (Feno) levels and blood eosinophilia in the whole asthmatic population (allergic and non-allergic children) expressed as (A) percentage of white blood cells and (B) the number of eosinophils/mm3.

Relationship between fractional exhaled NO (Feno) levels and blood eosinophilia in allergic children expressed as (A) percentage of white blood cells and (B) the number of eosinophils/mm3.
Discussion
Evaluating allergic and non-allergic children with stable mild intermittent asthma with comparable pulmonary function values and bronchial hyperreactivity, we found that allergic individuals had significantly higher blood eosinophil counts and Fenolevels. A significant correlation between blood eosinophilia and Feno levels was found only in the allergic group. Among the allergic population, no differences were found between mono- and polysensitised individuals in terms of pulmonary function values, degree of bronchial reactivity to methacholine, blood eosinophilia, and Feno levels.
NO is produced endogenously by several types of cells in the respiratory system including airway epithelial cells, vascular endothelial cells, alveolar macrophages, and inflammatory cells.24 In humans the relative contribution of the different cellular sources of NO in exhaled air is still uncertain. NO is formed by at least three isoforms of NOS that include two constitutive forms (endothelial NOS (eNOS or type III NOS) and neuronal NOS (nNOS or type I NOS)) and one inducible form (iNOS or type II NOS).24 ,25 The two constitutive isoforms, eNOS and nNOS, are basally expressed in many cells in the airways of normal individuals including airway epithelium, and may account for the low NO levels measured in exhaled air.24 In subjects with asthma a number of observations suggest that exhaled NO is likely to be derived mainly from iNOS rather than from constitutive NOS forms. Indeed, iNOS is rapidly induced by proinflammatory cytokines in a variety of cells including alveolar macrophages and airway epithelial cells.18 Moreover, increased levels of Fenoare observed during the late phase reaction that follows allergen inhalation challenge, suggesting that in vivo NO production may also reflect cytokine mediated inflammation.26
The present finding of higher levels of Feno in allergic than in non-allergic asthmatic children suggests that atopy itself may induce Feno production. Indeed, Feno levels seem to be similar in atopic healthy subjects and in normal controls (non-atopic non-asthmatic individuals).27-29 In contrast, higher Feno levels have been reported in atopic subjects with rhinitis than in those with non-atopic rhinitis,29 ,30 but in these studies the diagnosis of rhinitis was made on the basis of clinical history only without spirometric test and/or bronchial inhalation challenge data to exclude the presence of concomitant “silent” asthma.
Higher Feno levels in allergic asthmatic subjects may be the result of different pathogenetic mechanisms leading to the activation of different cell subpopulations and/or different cytokine production involved in the two asthma subtypes. In adults, atopic and non-atopic forms of asthma are associated with similar inflammatory and immunomediated changes.9 ,31 ,32 In fact, bronchoalveolar lavage and bronchial biopsy have shown increased numbers of eosinophils, activated T cells, and high affinity IgE receptor bearing cells in the airways of asthmatic subjects with no significant differences between allergic and non-allergic individuals.7 ,9 ,31 ,32 Other studies, however, have found distinct patterns of T cell activation and cytokine production in the bronchial mucosa and airway lumen of allergic and non-allergic asthmatics8 ,33-35 which may explain the difference in the observed levels of Feno. Under stable conditions, similar differences in Feno levels between atopic and non-atopic subjects with asthma have been reported in adults29 and in a small group of children.28It has recently been suggested that the increase in Fenolevels in asthmatic patients could, at least in part, result from a fall in airway pH.36 Indeed, lowering of airway pH not only produces bronchospasm and causes the release of bronchoconstrictor and proinflammatory substances from eosinophils, but also causes the conversion of endogenous nitrogen dioxide into nitric oxide.37 No data exist on the possibility that the two types of asthma may differ in airway pH values.
It is very unlikely that the pharmacological treatment of asthma in our patients interfered with the Feno levels recorded. The patients were taking only inhaled β2 agonists on an as required basis and these were discontinued at least 12 hours before the study. In any case, Feno concentrations are not affected by β2 adrenoceptor agonists.38
We found no differences between mono- and polysensitised individuals in the degree of bronchial reactivity to methacholine, blood eosinophilia, or Feno levels. This result is in agreement with a previous observation in school children sensitised to house dust mite in which similar blood eosinophil counts and degree of allergen induced mononuclear cell proliferation were detected in monosensitised and polysensitised individuals.12 Since only a few individuals were sensitised to pet dandruff or to moulds, and since this study was performed out of the pollen season, most of the cellular inflammatory response in the blood or in the airways of our patients could be related to subclinical allergen exposure to house dust mite, irrespective of the number of allergens to which the subjects were sensitised.
The observation of a significant correlation between Fenolevels and blood eosinophilia in allergic individuals with stable, mild, intermittent asthma is in agreement with previous observations17 ,19 ,39 and further supports the concept that Feno may indeed be related, at least in part, to the intensity of airway inflammation in these individuals. As for other markers of inflammation in asthma, their relationships may be lost after allergen exposure or steroid treatment, possibly because of the different temporal kinetics of the various parameters.40 ,41
The correlation between Feno levels and blood eosinophilia was lost when monosensitised children were evaluated alone, possibly because of the small number of individuals. Indeed, this sample (n=23) provides 10% power for the relationship between blood eosinophilia expressed as a number and Feno levels and 17% power for the relationship between blood eosinophilia expressed as a percentage and Feno levels. To achieve 80% power, 350 and 150 patients, respectively, would be needed.
Finally, we did not find any correlation between Fenolevels and pulmonary function parameters or bronchial reactivity to methacholine. The data reported here are similar to those reported in some of our previous studies and by others17 ,19 ,29 ,42 ,43 and further support the hypothesis that airway inflammation in patients with stable mild allergic asthma is not strictly related to the reduction in lung volumes, the degree of airflow limitation, or the intensity of bronchial hyperreactivity.22
Further studies are needed to elucidate the molecular mechanisms underlying NO production in the lower airways of atopic and non-atopic subjects with asthma.
Acknowledgments
The authors thank Dr Sabrina Zanardi and Dr Barbara Biasotti (Department of Health Science, Biostatistic Section, University of Genoa, Italy) who provided statistical support.