Article Text

Statistics from Altmetric.com
About this guidance
This guidance is the result of almost two years of work and has been written in parallel with the Smoking Cessation Guidelines for Health Professionals 1 which forms the first part of this Supplement to Thorax. The guidelines are also published in a shortened version as an article in the BMJ(BMJ 1999;318: in press).
Acknowledgements
This study was funded by the Health Educa-tion Authority. We are grateful for their administrative and managerial support throughout the project. We would also like to thank David Buck who contributed to the brochure which preceded this guidance and the planning stages of the guidance, Nicky Willis, and the experts who compiled the effectiveness estimates.
Thanks are also due to The Data Archive, used by permission of the Office for National Statistics, for data provision.
Purpose of this guidance
The purpose of this guidance is to demonstrate the health and economic case for smoking cessation and to help health authorities to plan smoking cessation services. In it we:
outline the costs to the NHS of treating diseases caused by smoking, both nationally and for a typical health authority;
discuss the reasons for measuring cost effectiveness and some of the issues involved in doing so;
discuss some misconceptions about cost effectiveness, including the idea that preventive interventions increasehealth care costs;
review the effectiveness of some key smoking cessation interventions and transform cessation rates into population health gain;
estimate the costs of these key smoking cessation interventions;
estimate their cost effectiveness in terms of cost per life year gained.
This guidance is based on the best information currently available but local data, both costs and possibly cessation rates, will differ from data in published studies, as will local priorities. Thus we explain how to estimate outcomes and costs based on the research literature. We then provide a set of worked examples and demonstrate how to build up estimates of cost effectiveness of a new smoking cessation programme compared with current practice for a health authority with an average population. We emphasise, however, that these worked examples are illustrative, and that health authorities need to design services according to local needs, and collect outcome data locally. This guidance should help them to do so.
The interventions modelled, especially the face to face ones, are based on very strong published evidence of efficacy. The results illustrate the value for money of smoking cessation interventions.
Who this guidance is for
The guidance is for those involved in planning health services locally, including commissioners, and the public health and other health professionals who will advise them and deliver the services.
Structure of this guidance
SECTION 2: THE CASE FOR SMOKING CESSATION
Section 2 makes the case for investing in smoking cessation. The costs of smoking to the health service are outlined, and the resulting health gain that would be seen were smoking to be reduced. The case for measuring cost effectiveness is presented with an explanation of some of the issues involved in doing so. Some common argumentsagainst smoking cessation interventions are critically examined.
SECTION 3: EFFECTIVENESS
The effectiveness evidence is summarised. From the effectiveness data population cessation rates are estimated and then transformed into population health gain in life years saved. This is done for a core set of interventions, based on the literature, through worked examples. The interventions are:
face to face interventions;
community based interventions.
The face to face interventions illustrate the benefits and costs of increasing the elements in a smoking cessation programme as follows:
brief advice;
brief advice and self-help materials;
brief advice, self-help materials, and advice to use nicotine replacement therapy (NRT);
brief advice, self-help materials, advice to use NRT, and a specialist smoking cessation service.
The effectiveness evidence is drawn from systematic reviews of the literature summarised in the accompanying guidelines which form the first part of this supplement.
Estimates of the cost effectiveness of smoking cessation interventions during pregnancy are not included as the simulations cannot be performed with the model used for this guidance. The information presented in the paper by Buck and Godfrey2 is therefore recommended.
SECTION 4: COSTS
The costs of these interventions are estimated.
SECTION 5: COST EFFECTIVENESS
The effectiveness and cost information are combined to estimate cost effectiveness in terms of life years gained.
Updating the information
It is hoped that both this guidance and the clinical smoking cessation guidelines will be updated periodically, as further published evidence of effective interventions accumulates and as cost data change.
Key estimates
COST OF SMOKING RELATED DISEASES TO THE NHS
The annual cost to the NHS of treating diseases caused by smoking in England is £1500 million using the method which costs different smoking related diseases and the fraction of cases attributable to smoking, or £1400 million using the method which looks at the differences between the health costs of smokers and non-smokers (see page S4).
For a typical health authority with the national average population, smoking costs £14 million a year, broken down as follows: GP visits £2.5 million, total prescriptions £1.5 million, inpatient stays £3.2 million, day cases £1.9 million, outpatient visits £4.9 million (see page S6).
COST TO A HEALTH AUTHORITY OF KEY SMOKING CESSATION INTERVENTIONS
It should be emphasised that the figures represent theadditional cost above a health authority’s current spending on smoking cessation interventions—that is, current normal practice. The total annual cost to a typical health authority of brief advice (in addition to the current level of cessation help) delivered opportunistically in primary care (the precise specifications and assumptions are described in the text) would be approximately £123 000 (see page S21). For brief advice plus the offer of some self-help materials the figure is £209 000 (page S22), for brief advice plus self-help materials plus advice to use NRT the figure is £286 000 (page S22), and for brief advice and provision of a specialist smoking cessation service the total annual cost to the health authority to deliver the whole package of interventions would be £331 000 (page S23). The estimates include the cost of extra time required by health professionals delivering these interventions.
COST EFFECTIVENESS OF KEY SMOKING CESSATION INTERVENTIONS
Using the figure above, providing brief advice opportunistically to smokers in a typical health authority would cost £174 per additional life year gained (page S25). The addition of the offer of self-help materials to the brief advice would increase the cost to £221 per life year (page S25) but would increase the total number of life years gained. Adding advice to use NRT to the brief advice and self-help materials would cost £269 per life year saved (page S25), again with more lives being saved in total. Finally, if smokers were given access to a specialist smoking cessation service (see text for details of service, reach assumptions, and effectiveness) in addition to the other elements of the programme, health gains would be produced at a cost to the health authority of £255 per life year gained (page S25).
When the total societal costs and costs to the smokers are added to the health authority costs, the most expensive of these interventions—the offer of specialist smoking cessation support—comes out at £873 per life year gained (page S25). This compares favourably with the review undertaken by Tengs et al 3 who found the median societal cost of over 310 medical interventions to be £17 000 per life year gained. The results presented in this guidance provide strong evidence on the value for money for commissioners of local smoking cessation programmes.
The case for smoking cessation
The first stage in any planning process involves marshalling arguments to support the case for investment in the area. The very low level of investment in smoking cessation in the health service suggests that there is resistance to investing in smoking cessation.4
This may well be because of a perception that smoking cessation interventions are not effective, a perception which is incorrect (see Section 3). Linked to this may also be the perception that smoking cessation interventions are not cost effective.
In fact, a recent international review found the median societal cost of over 310 medical interventions to be £17 000 per life year gained.3 Our estimates range from approximately £212 to £873 per life year gained (see table 31). Even if our figure was substantially over-optimistic, smoking cessation would remain better value than many life preserving medical interventions.
Cost effectiveness estimates (society)
The most compelling case for investing in smoking cessation is the huge impact smoking has on health, and the consequent health gain which would be seen if smoking rates were reduced. A number of studies have provided estimates of both the number of deaths caused by smoking and of its effect on ill health.5 ,6 The impact of smoking can also be expressed in life years lost and in financial costs to the NHS of smoking related diseases. These impacts are described below.
The cost of smoking to the NHS
The current cost of treating diseases caused by smoking in a particular year is estimated by two methods:
- (1)
- Attributing the costs of different diseases to smoking.
- (2)
- Examining the different health care costs of smokers and non-smokers.
These methods yield annual prevalence based costs. They should yield broadly similar estimates.
Two estimates of annual prevalence based smoking related costs for England at 1996 costs were presented by Buck et al.7 These have been updated using the recently released new estimates of tobacco related morbidity and mortality,5 yielding the figures shown above.
The costs determined by both methods relate only to smoking related causes. There is no adjustment for the fact that smokers have, on average, a shorter life than non-smokers, the implications of which are dealt with later in the section on “Some misconceptions about cost effectiveness”. In any one year the prevalence based figures will depend on the accumulating past and current smoking rates. These estimates also exclude the excess costs of passive smoking in the unborn child, children, and adults. A previous estimate of the cost of treating diseases caused by passive smoking was £410 million for England and Wales.6
Annual costs of smoking to the NHS in England
£1500 million Method 1: Direct estimates of costs of treating diseases caused by smoking
£1400 million Method 2: Differences between the health care costs of smokers and non-smokers
DERIVATION OF SMOKING RELATED COSTS BY COSTING DISEASES (METHOD 1)
This is a relatively simple methodology and could be adapted to give locally based estimates. The main steps are:
estimate all health care costs by ICD (WHO classification) disease category;
calculate the proportion of each disease category attributed to smoking from relative risk factors of each disease and current smoking rates;
apply the smoking attributable fractions to the disease categories to get an estimate of the health care costs.
An NHS Executive study published in 1996 gives a breakdown of both life years lost and the costs to the NHS across all diseases.8 The NHS costs in this study are broken down into hospital costs, primary care costs, and the cost of pharmaceuticals. The figures were calculated using data from 1992/3. For this study these figures were inflated by 8.4% (using the HCHS Pay and Prices Index).
The smoking attributable fractions were taken from Callum.5 Table 1 gives an estimate of the smoking attributable loss in life years, and table 2 gives an estimate of the breakdown of the £1.5 billion estimate of NHS costs for England by disease. This estimate differs from the costs presented by Bucket al 7 which are based on mortality rather than morbidity.
Estimated life years lost as a result of smoking related disease, 19911-150
Estimated cost to the NHS as a result of smoking related disease, 199112-150 (all figures are in £million)
In table 3 we have calculated the figures for different regional offices, and in tables 3 and 4 the figures are given for a typical district health authority within the region. These figures are only based on population averages and do not take account of different smoking prevalences across the regions.
Estimates of costs and life years lost as a result of smoking related deaths by regional offices
Life years lost and cost of smoking related disease per health authority (HA)
DERIVATION OF SMOKING RELATED COSTS USING THE DIFFERENCES BETWEEN SMOKERS AND NON-SMOKERS (METHOD 2)
This methodology is rather more complicated and would be more difficult to replicate at a local level. The data used were from the 1994 General Household Survey (GHS)10 which contains data on both smoking status and self-reported health service use. For this exercise we obtained individual level data from the Data Archive rather than using the published figures.
Individual observations from the 1994 GHS were coded according to age and sex. Each age/sex group was further subdivided into ex-smokers, current smokers, and never smokers. The average use of health care in terms of GP visits, prescriptions, outpatient, day patient, and inpatient stays was calculated. Prescriptions and GP visits are recorded only over a two week period and the reported figures were scaled up to estimates for a year. Outpatient visits are recorded over a three month period and these were also uprated to annual figures. The figures from the GHS were then uprated to the total population of England, and the average number of health care episodes per person was then multiplied by the population number for the respective group in order to estimate the total health care use.
The GHS provides health care utilisation figures but no costs. The figures relate to five types of activity: GP visits, inpatient stays, outpatient visits, total number of prescriptions, and number of day cases. Costs are estimated by using the average figures for each of these five types of activity. (Whether this leads to an underestimate or overestimate in costs is not clear, but there is no reason to expect either.) The figures used and the sources of these figures are given in table 5. The estimated unit costs for average episodes were then multiplied by the total number in each age, sex, and smoking status group.
Unit costs of health care, 1996
Estimates of smoking related costs were then calculated by summing the differences between the calculated health care costs of current smokers and the health care costs of lifetime non-smokers. If some age/sex groups of lifetime non-smokers had higher costs than the equivalent current smoker group, the negative sums were included. The figures are therefore based on the observed differences averaged across all groups. The “negative” differences between lifetime non-smokers and current smokers may reflect sample fluctuations. Health care costs are skewed with a few people having very high use and the majority making few demands on the health service. Using the differences of all groups, whether positive or negative, serves to reduce the effect of such sampling fluctuations. This method yields an estimate based on GHS figures alone of £705 million.
The GHS is based only on private households and therefore does not cover the whole population. People in hospital and long term care, for example, are excluded. Grossing up all health service use from the GHS will be below the total health care expenditure for England. Using health care utilisation statistics from the 1994 GHS, and the average costs shown in table 6, total health care expenditure is estimated to be £12 808 million in 1996. Comparing this estimate with actual total health care expenditure (total £24 714.6 million for 1996) suggests that GHS figures only account for 51.8% of all health care expenditure. In other words, any estimate from the GHS would need to be uprated by (24714.6/12808.3) or 1.93. We have no figures to check whether this “under reporting” differentially affects smokers and non-smokers, although many individuals excluded from the GHS may be elderly and/or in hospital or long term care. However, uprating the GHS estimate to reflect the total population use yields an estimate of £1360 million for the costs of treating diseases caused by smoking.
Annual costs of smoking for a typical health authority
This estimate is based only on the excess health costs of current smokers compared with lifetime non-smokers. The costs of smoking related diseases in ex-smokers are not included. As many give up smoking because of smoking related ill health, this methodology will be an underestimate. Ex-smokers are on average older than current smokers. People may also give up smoking because of ill health and that ill health may not always be smoking related. Inclusion of the excess health costs of ex-smokers in the total may therefore overestimate the smoking related costs compared with the alternative methodology. However, excluding ex-smokers clearly underestimates smoking related costs.
APPLYING THESE ESTIMATES TO LOCAL POPULATIONS
The simplest way of deriving an estimate of smoking related disease costs for a local population is to pro-rate the national figure to the local population. The population of England is 48 532 705 so an average health authority has approximately 485 327 residents. Rounding up to a population of 500 000, the smoking related costs are £14 million per annum. These costs are presented in table 6.
More specific estimates could be made by applying different numbers of current smokers and lifetime non-smokers to the local population along with the estimates from the GHS. It is also possible to update the figures used in this guidance, and we hope to issue updates as new data are released.
The case for measuring cost effectiveness
Health care needs are virtually unlimited, whilst the resources available for the provision of health care are finite, usually taking the form of a cash limited budget. In order to secure resources for the expansion of a health care programme it is necessary to demonstrate its cost effectiveness relative to alternative health care interventions. By allocating resources to the most cost effective interventions, the maximum effectiveness (in improving health) can be obtained from the available health care budget.
This process can take place at a number of different levels. There may be a predetermined budget for smoking cessation interventions with the question being how to maximise health gains within this budget. The task would then be to examine the relative cost effectiveness of different smoking cessation interventions. In this case, examination of the net costs per ex-smoker created would be sufficient.
A broader question concerns how resources should be deployed within a wider expenditure category—for example, all prevention programmes. In this case measuring smoking cessation programmes in terms of the number of ex-smokers, while other programmes were measured in terms of some other behaviour change, would not allow comparisons to be made. An outcome measure common to all interventions being considered is therefore required. This requires conversion to a general health outcome measure, typically life years gained.
Broader still would be the question: what resources should be allocated to smoking cessation interventions compared with those devoted to other health care interventions?—a question that is rarely asked. As not all health care interventions prolong life, it is necessary to devise some measure which is capable of combining improvements in the quality and quantity of life.
The practical problem is that information about cost effectiveness of health care interventions is limited. Decisions across broad areas have to be made with a degree of uncertainty. Reviews of cost effectiveness have placed smoking cessation interventions near the top of more general league tables—for example, Maynard14—although interpretation of such league tables should be made with care.15 ,16
In this guidance we indicate how data on costs and effects can be collated to help the decision making process across a wide range of questions that may arise at a local level. The examples are presented in terms of the estimated net costs per life year saved, a broader measure than cost per ex-smoker created.
Currently there is insufficient information to incorporate changes in the quality of life of those stopping with the life years gained, although Tillmann and Silcock17 have noted that smoking cessation leads to a significant improvement in a range of respiratory symptoms and health related quality of life, and found significant differences in perceived quality of life between smokers and ex-smokers. The methods set out in this guidance thereforeunderestimate the potential health gains from smoking cessation interventions. However, the results could be used in broad comparisons of alternative programmes which health authorities and primary care groups will have to consider in their planning process.
Decisions will rarely be made purely on the basis of the cost effectiveness of an intervention. Other considerations such as equity, historical provision, and acceptability may enter the decision making process. In calculating cost effectiveness all resource use is considered. However, some of these resources, such as health professionals’ time, may not have immediate budgetary implications. General practitioners’ time, for example, is financed by a specific mechanism, but any of their time devoted to smoking cessation means less time is available to be spent on other activities, thus it has a real cost. At some levels of increased smoking cessation activities more practice staff may have to be employed. In the simulations presented in this guidance practice staff time is included in the costs.
Some key issues in measuring cost effectiveness
Cost effectiveness analysis involves comparing cost and effectiveness information for two or more interventions. The results can then be presented in terms of the additional cost per unit of effect for one intervention compared with another. Firstly, the programme of interest must be defined and the costs of providing the programme and the effectiveness of the intervention calculated. Secondly, the costs and effects of a comparison programme are also calculated. This comparison programme is of crucial importance in determining the results. In smoking cessation studies the comparison programme is usually either a “do nothing” option or current practice (the cessation intervention being used at the time). Figure 1shows the basic principle of economic evaluation in which programme A incurs costs and consequences which are then compared with the costs and consequences of programme B.

A simple model of economic evaluation. Adapted from Drummond et al.18
There are different types of costs and outcomes. These are briefly outlined in fig 2. Costs can be divided into three broad groups: cost to the health unit delivering the intervention; other costs to the health care system (or non-health agencies) related to the cessation programme; and costs borne by individual smokers and their families related to the programme.
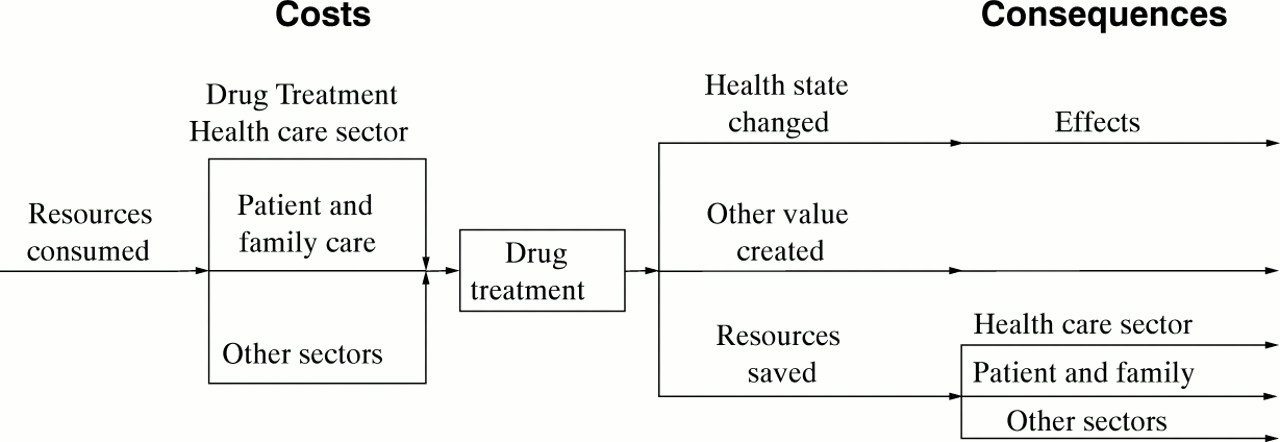
Illustration of components of an economic evaluation. Adapted from Drummond et al.18
The outcomes can also be divided into three groups: the change in quality and quantity of life for the smoker; resources saved within the health or social care sector; and resources saved in other sectors of the economy or by individual smokers and their families.
Once the costs and outcomes of the two programmes are available the results can be combined to produce figures giving the net average cost per unit of outcome gained. For example, suppose a local advertising campaign about the problems of smoking costs £150 000 to design, produce and broadcast. The alternative is assumed to be a “do nothing” option. The local population comprises 150 000 adults of which 30% smoke. Suppose the campaign is seen by 70% of the population and 1% have stopped smoking at the one year follow up as a result. The 1050 ex-smokers created therefore cost a total of £150 000 compared with the “do nothing” alternative. Dividing the total cost by the number of quitters yields a cost of £142 per ex-smoker created.
A number of key points must be addressed when collecting, measuring, and interpreting information and constructing cost effectiveness tables. The first issue is to determine which outcomes and costs to include.
MEASURING OUTCOMES
Investigators undertaking a cost effectiveness study must decide which outcome measurement to use from a range of clinical indicators. This is less difficult in smoking cessation because the majority of studies use the intermediate measure of quit rates as the main outcome, which is useful in comparing different types of smoking cessation intervention. However, this is of no use when comparing cessation help with other health care programmes, for which purpose a less specific outcome measure is required. Life years gained is one alternative outcome measure which can be used to proxy long term economic gain for individuals, the NHS, and society. Using life years gained enables a purchaser to compare alternative health care programmes using a uniform outcome measure, and therefore to allocate a health care budget to maximise potential health gain.
Duration of follow up is a potential source of inconsistency. Studies have used different follow up periods, and those studies with a short follow up will tend to show higher success rates than those with a longer follow up because some subjects will later relapse to smoking.
However, there are consequences resulting from a smoking cessation programme besides the direct health benefits to the patient. One such benefit is the saving in future smoking related health care costs. The average smoker sees his or her GP more often than a comparable non-smoker, receives more prescriptions, and is more likely to be referred to hospital for an outpatient appointment. The main resource in primary care is the cost of GPs’ time. Stopping smoking should improve health and the greater the health gain, the greater should be the reduction in smoking related health care costs. Table 7 provides a checklist of the potential consequences of a cessation intervention.
Potential benefits and other consequences to measure in an economic evaluation
MEASURING COSTS
Economists measure costs in terms of opportunity cost, which is the value of the next best use of the resource in question. This arises because society’s demands are unlimited whereas resources are finite. The use of resources for one project means that they are not available for use in an alternative project. The value of the alternative forgone is the opportunity cost. For example, if resources are used for a smoking cessation programme, they cannot be used for other purposes such as cholesterol testing. The costs of an intervention include those borne by: the service provider, the patient, and society as a whole. Provider costs include the cost of premises, the salaries and wages of staff, and the cost of pharmaceutical products. Costs to patients include financial outlays such as prescription costs, plus the time required for participation in the programme. Costs to society may include the cost to employers if patients attend treatment in paid work time (table 8). However, there is some debate regarding the classification of some of the costs in an economic evaluation (see Drummond et al 18 for a more complete guide to undertaking economic evaluations).
Potential costs to measure in an economic evaluation
Researchers should present a list of costs that have been included in the analysis and provide a rationale for their inclusion or exclusion, together with details of how they have been measured and valued. In Section 4 further details of the potential costs of an intervention from different settings are provided, together with an example of costing GP time.
RELATIONSHIP BETWEEN OUTCOMES AND COSTS
There is a relationship between the costs of a programme and the benefits produced. Increasing resource intensity will increase costs. However, benefits can also be expected to increase. For example, a smokers’ clinic may employ an additional nurse. Assuming the same number of clients are treated, the staff to patient ratio will increase and the health benefits may also be expected to increase. In addition, the clinic could purchase more expensive equipment or employ staff of higher grades, which are also likely to increase the benefits of the service.
PERSPECTIVE OF A COST EFFECTIVENESS STUDY
The perspective of a study will have a significant effect upon the cost effectiveness results. If a study is undertaken from the health care provider’s perspective, only the health care provider’s costs will be included. Costs incurred by other organisations or individuals would be excluded. Alternatively, a study undertaken from a societal perspective would include all costs and benefits, regardless where they fall.
No Smoking Day (NSD) can be used as an example to illustrate these approaches. The Health Education Authority (HEA) spends resources supporting NSD, a programme which also relies on the funding and co-operation of other national and local health organisations, professionals, charities and individuals. A cost effectiveness study from the perspective of the HEA would aim to maximise the number of quitters at the least outlay to the HEA. However, this would provide a misleading estimate of the total social costs, as costs borne elsewhere are excluded.
In the extreme situation, taking a narrow perspective would favour interventions which shift costs to other parties. A more comprehensive and informative cost effectiveness study would include all health care costs and costs to the smoker—for example, out of pocket expenditure and the cost of time.
For smoking interventions this is most clearly illustrated by nicotine replacement therapy (NRT). Currently the cost of purchasing NRT is borne by the individual smoker. The inclusion or exclusion of these costs can considerably alter the relative rankings of alternative smoking cessation interventions.
Table 9 shows the different cost and benefit categories that would be included in a study from the perspective of society, the health care unit delivering the smoking cessation intervention, the NHS, and the client.
Costs and benefits from different perspectives
The perspective of society as a whole provides the most comprehensive viewpoint for an economic evaluation. If the study is undertaken using the standpoint of the NHS, it will exclude costs incurred outside the health care sector such as client and employer costs. The perspective of a health promotion unit alone will exclude the benefits of a reduction in health care usage which represents future savings to the NHS. The perspective of the client alone will only be concerned with costs which are incurred by patients. These include prescription charges and the cost of time and travel to the GP’s surgery or setting for the intervention.
Costs to the smoker should be included in a cost effectiveness analysis since they are likely to affect the uptake of an intervention.
Some misconceptions about cost effectiveness
COMMISSIONING SMOKING CESSATION INTERVENTIONS WILL INCREASE HEALTH CARE SPENDING
There is considerable confusion about the health care costs related to smoking. Although the calculations above indicate that smoking has an impact on health care expenditure, some argue that reducing smoking would increase, rather than decrease, health care spending. This argument can be considered in two parts.
There is general agreement that smokers have higher health related costs in their lifetime than non-smokers. This was illustrated by Hodgson19 and by a recent Dutch study.20Whilst it would be useful to have UK data, there is no reason to believe that this is not also the case in the UK and, indeed, the figures calculated above give some supporting evidence. The research also suggests that these higher costs occur at all ages.
Reducing smoking would reduce the costs of smoking related disease. However, it is more difficult to predict when these savings would be realised. Some smokers give up because of a smoking related illness episode and it takes some time for their excess risks to reduce. On the other hand, those smokers who give up earlier are likely not to have experienced much excess health care due to smoking. Nevertheless, savings in smoking related cancer, lung and heart disease will occur over time.
The second part of the argument is that, by reducing smoking rates, there will be an extension of life. As elderly people in general use more health services than younger people, then any increase in life expectancy would increase overall health service costs as many countries are currently experiencing. However, this effect would not impact specifically on smoking related disease. It would impact onany life prolonging intervention and most preventive programmes. The question is therefore: should such effects be included in a cost effectiveness analysis, offsetting the value of the health gain benefits?
This effect would especially disadvantage interventions which saved the lives of younger people. Thus, including all potential lifetime health care costs, whatever the cause, when saving the life of a baby or young child would make saving this life extremely expensive. Economists vary as to whether these types of costs should be included in cost effectiveness studies. A recent US panel suggested that such costs should be excluded, as should the health benefits of any future health care interventions for individuals surviving longer.21Whether included or excluded the principle applies equally toall interventions, not just those involving smokers, if cost effectiveness is being compared for planning purposes.
In fact it is not clear whether, if costs are calculated over the whole lifetime of a smoker, reduced population rates of smoking will lead to higher or lower health care costs (as ex-smokers have extended life spans). Two recent studies came to conflicting conclusions, which may be due to methodological differences. Hodgson19compared health care costs of smokers and non-smokers using American data. He also took into account the higher costs of dying. Barendregtet al,20 using Dutch data, used a disease based model. However, the results may also reflect different smoking rates, population dynamics, and health care costs of the two countries. This is an empirical issue. The results will vary across countries and over time, especially as health care technology changes.
There are no UK lifetime cost studies. We therefore do not know in the UK whether reductions in smoking will decrease or increase total health care spending over time. This is an area where more research is clearly needed.
The steps required would involve modelling the current population cohort, their projected health care costs, and the results of different quitting behaviour. This type of model could also take into account the additional overall costs of living longer by those who give up, and hence incurring health care costs over a longer period.
The steps required would be:
- (1)
- Determine the characteristics of the lifetime smoking population.
- (2)
- Follow a cohort and estimate smoking related and non-smoking related health care costs depending on projected smoking rates.
- (3)
- If projecting over a long time period the effect of new cohorts of smokers would need to be added.
- (4)
- Estimate the life expectancy of the population given smoking rates and projected mortality rates.
- (5)
- Calculate the costs of health care around time of death (these are much higher than average).
- (6)
- Annualise health care cost projections over required time period.
This would give the baseline figures against which any changes in smoking prevalence rates due to any intervention could be compared and the total effects of health care costs could be calculated. These types of calculations require several assumptions. Not all figures can be accurately projected—for example, changing health care technologies can radically alter the cost projection for different diseases.
However, such figures would only form part of any cost effectiveness calculation. Rejecting any health care intervention on these health care cost arguments alone would clearly be absurd. Taken to extremes, the approach would suggest that most health care interventions should not be undertaken, especially those that produced the greatest life expectancy gain, because benefits are not considered.
SMOKERS ARE TOO ADDICTED TO STOP
Nicotine is addictive, and overall population smoking cessation rates, as well as cessation rates in clinical treatment trials, may appear low. On the other hand, around 10 million smokers in the UK have stopped in the last 20 years. Even apparently modest abstinence rates will produce considerable health gains to a community at a modest cost and produce very good value for money when compared with most other health care interventions.
LOCAL INTERVENTIONS WILL HAVE NO IMPACT ON POPULATION RATES
It takes a considerable change in any health condition to be able to measure accurately a change in the population rate of a disease or behaviour. But real health gains can occur.
In the worked examples presented in Sections 3–5, even with very modest assumptions about effectiveness, effects on population rates should be visible. One objective of the examples is to indicate the size of population effects that could be predicted. This may help to give some realistic targets for local interventions and real success for health professionals can then be acknowledged.
Effectiveness
In this section we estimate the effectiveness (cessation rates translated to population health gain) of two types of worked examples:
- (1)
- face to face interventions;
- (2)
- community based interventions.
The face to face interventions are:
brief advice;
brief advice + self-help materials;
brief advice + self-help materials + advice to use NRT;
brief advice + self-help materials + advice to use NRT + specialist smoking cessation service.
The evidence base
Decisions about the purchasing and provision of health care should be based on interventions proved to work (the principle of “evidence based medicine”). The problem is that, for many interventions, there is little or no good evidence of effectiveness. However, this is not the case for smoking cessation. A very large number of controlled trials have demonstrated effective smoking cessation interventions, particularly NRT.
There are three major levels of published effectiveness information:
- (1)
- Primary studies: randomised controlled trials, community studies.
- (2)
- Systematic reviews.
- (3)
- Reviews of reviews.
In general, randomised controlled trials give the most accurate estimates of effectiveness. By randomly allocating patients to alternative treatments, many of the confounding factors that would result from patient or clinician choice are removed. However, it is difficult to evaluate community based interventions in this way and other study designs will be more appropriate.
Systematic reviews locate, evaluate, and synthesise evidence from primary studies. They are based on strict guidelines in order to minimise bias and include all identifiable research.
Obviously reviews can offer decision makers substantial information without the need to search for individual studies. However, few health professionals will have time even to seek out reviews. A recent survey of GPs’ opinions on evidence based medicine emphasised that their need is not so much for better access to libraries or information searching technologies, which they have limited time to use, but for good quality summaries of evidence to be made available to them.22
Reviews of reviews summarise the key findings of systematic reviews, often undertaking meta-analyses on their pooled data. They then present the key clinically important conclusions. Pooling data in a meta-analysis will increase sample size and therefore reduce standard errors and increase confidence in effect sizes. However, care must be taken that it is reasonable to pool the results from different studies using different populations.
These three main sources of evidence of effectiveness all have advantages and disadvantages, but systematic reviews using meta-analysis are valuable because of the confidence that can be placed in the effect revealed being significant.
The Cochrane Centre publishes systematic reviews of smoking cessation interventions. These are available on diskette and CD ROM23 (The Cochrane Collaboration, Issue 2. Oxford: Update Software, 1998. Updated quarterly), and the abstracts are available free online at www.cochrane.co.uk . There is also anEffectiveness Matters bulletin on smoking cessation.24
In the USA the Agency for Health Care Policy and Research (AHCPR), part of the US Public Health Service, has published clinical guidelines on smoking cessation based on a systematic review and meta-analysis of evidence tables.25
Finally, smoking cessation guidelines for health professionals in England, based on the Cochrane Library and AHCPR reviews,1appear as the first part of this supplement. It is hoped that these guidelines will form the basis of the NHS’s approach to smoking cessation, and the interventions modelled in this guidance are based on these clinical guidelines.
Table 10 is based on the clinical smoking cessation guidelines1 and summarises the effectiveness of key interventions.
Incremental effectiveness of cessation interventions
Current systematic reviews have focused on health care interventions. However, these are only some of the interventions potentially available at the local level. The Cochrane Centre is conducting systematic reviews on local retailer interventions to stop under age sales, mass media interventions with young people, community interventions directed at young people, and school based interventions. However, the research base of community based interventions is not yet as rigorous as that for face to face clinical interventions.
Obviously there are gaps in current knowledge. Furthermore, local plans may focus on specific populations—for example, people with heart disease—or interventions not yet reviewed systematically. However, such reviews require considerable time and resources to undertake, and there is already sufficient evidence to recommend many effective interventions.1
From effectiveness to cessation rates
Modelling cost effectiveness locally requires translating effectiveness estimates from published research to the local population.
Local cessation rates may differ from published estimates because:
Local conditions may not reflect the conditions in published studies—for example, local smokers may have to pay for NRT whilst in published trials NRT was provided free.
Smokers may have different characteristics; published research involving individuals who volunteer for a study may show higher success rates because the subjects are a self-selected group who are motivated to stop. Possibly even more important, the clinicians are likely to be self-selected and therefore more interested and motivated.
For community interventions the population estimate of the cessation rate achieved will depend on the success of the intervention in reaching smokers. This may well depend on the intensity of the intervention.
From cessation rates to life years gained
There are two main methods used to translate cessation rates into life years gained. Using simple life expectancy estimates, cessation rates are translated into life years saved when smokers stop smoking at different ages. A greater number of life years will be saved if a young smoker stops compared with an older smoker. Alternatively,epidemiological modelling can be used to simulate the life years gained and impact on smoking related disease of an increase in the cessation rate. Life years saved by different ages can be built into such models.
In this guidance we have used the second method, using the computer simulation PREVENT.26 PREVENTworks by estimating the impact of a change in an exposure category (smoking prevalence) upon a number of diseases. The relevant diseases are lung cancer, coronary heart disease (CHD) and chronic obstructive pulmonary disease (COPD).
The estimated increase in the cessation rate following an intervention is entered into the model. The reduction in smoking prevalence is then translated into a reduction in deaths from smoking attributable diseases, after adjusting for the risk of deaths from other causes. From this the life years saved are calculated.
PREVENT estimates the total life years gained up to the year 2041. Our results are for England and Wales, and we have scaled them down to represent a typical health authority with a population of 500 000.
Worked examples
Two types of worked examples are included:
face to face interventions;
community based interventions.
The examples below are followed through in Section 4 where their costs are estimated, and in Section 5 where their cost effectiveness is estimated.
To estimate cost effectiveness it is necessary to have two or more alternatives to evaluate. For this exercise we needed a baseline simulation. Clearly some smoking cessation activity, both face to face and community based, already takes place along with broader national policy measures such as tax increases.
Analysis of smoking prevalence trends suggests that the background cessation rate in England is approximately 1% a year.27This was assumed to affect all groups of smokers equally and was used as our baseline simulation with the PREVENT model. The baseline simulation results in an estimate of 188 429 life years saved compared with no changes in smoking behaviour between 1998 and 2041. In the interventions outlined below the health gains over and above this baseline simulation were estimated.
Smoking clearly affects the quality of life as well as the quantity of life, and a number of studies have used some estimate of the gain in well being. However, the adjustments have been somewhat arbitrary and would be directly in proportion to the health years gained. For these simulations no adjustments of this kind were made. If such adjustments had been made, cost effectiveness ratios for smoking interventions would be even more favourable when compared with those calculated for other health care interventions.
WORKING OUT THE EFFECTIVENESS OF FACE TO FACE INTERVENTIONS
The starting point for the simulations was the reviews of effectiveness evidence already mentioned. One year continuous abstinence rates in those attempting to stop (not in all smokers) were then (conservatively) estimated (table 11). The figures in the table have been circulated to international experts in smoking cessation and agreement reached as to their likely accuracy. The derivation of the figures is given below.
Effectiveness estimates of face to face interventions
The figures in the table are best estimates of real world cessation rates for the average smoker who tries to stop using each of a variety of methods. These figures cannot be drawn directly from the research literature because:
- (1)
- individual studies use different study populations with different characteristics;
- (2)
- studies typically use volunteers;
- (3)
- clinical trials usually involve trained staff with a special interest in smoking cessation;
- (4)
- staff running research trials may be expected to operate with a higher level of rigour and enthusiasm than those running routine services.
The derivation of each figure is as follows:
Cessation rate: willpower alone
A 3% continuous abstinence rate from the cessation date for 12 months is achieved using willpower alone. The best estimate of this figure comes from a study which asked for volunteers who were proposing to stop smoking without help.28 This is a US study and no comparable data exist in the UK. However, population surveys indicate that approximately one third of smokers make an attempt to quit each year,29 and 1% of smokers actually succeed in becoming long term ex-smokers,27 which implies that approximately 3% of those who try to stop in a given year succeed in doing so. Surveys also show that the majority of these cessation attempts are undertaken without help.29
Cessation rate: with self-help materials
The term “self-help materials” covers widely different things and, of course, these can be well or badly constructed. Thus, a single figure for effectiveness must be viewed with caution. The cessation rate of 4% derives from an assumed increment of 1% which is slightly lower than the figure arrived at in a recent meta-analysis of the use of self-help materials in a treatment context.25 Use of pamphlets in isolation was not found to be effective.
Cessation rate: NRT bought from a pharmacy
Evidence from clinical trials indicates that NRT of whatever form approximately doubles cessation rates compared with placebos, whatever the setting.25 A doubling of the willpower alone rate yields 6%. This figure is slightly lower than the figure from a recent large clinical trial in which cessation rates when NRT was dispensed at a pharmacy were compared with those when NRT was prescribed by a physician.30
Cessation rate: smokers’ clinics not using NRT
The figure of 10% is somewhat lower than the average cessation rate in placebo or control groups examining the effect of NRT and other pharmacological interventions in smokers’ clinics,31 but takes account of a likely drop in efficacy in routine care compared with a formal study. The increment over and above the willpower alone rate is slightly lower than the estimated effect of “intensive” behavioural support in a recent meta-analysis.25
Cessation rate: smokers’ clinics using NRT
The figure of 20% is somewhat lower than the average in the active treatment groups of trials examining the effect of NRT in smokers’ clinics31 but reflects a likely lowering of overall abstinence rates in routine clinical practice compared with clinical trials.
The next step is to define the role of different health professionals.
It is important to note that brief advice from a physician typically increases the number of cessation attempts, while more intensive help—for example, smokers’ clinics—and NRT increase the chances of success for a given attempt to quit.
As already mentioned, clinical smoking cessation guidelines for the NHS in England are now available and form the first part of this Supplement.1
The interventions are based on those described in the clinical guidelines:
brief advice;
brief advice + self-help materials;
brief advice + self-help materials + advice to use NRT;
brief advice + self-help materials + advice to use NRT + specialist smoking cessation service;
various community programmes.
The next step is to calculate how population smoking rates will change as a result of these interventions. For this we need to calculate the population impact of each intervention. These rates then form the input to the PREVENT computer model to estimate the health gains.
Approximately 25% of smokers in England are currently advised to stop smoking by a health professional each year.29 This feeds into the 1% population cessation rate of the general population. The effects of this current level of intervention are included in the baseline simulation. The worked examples therefore relate to the 75% of smokers not currently receiving advice.
Advice from a health professional will increase the proportion of smokers attempting to give up. From studies on the effect of physician advice about 40 of every extra (over and above current usual practice) 100 smokers given advice by a health professional will attempt to stop smoking in a year.
However, even if a huge effort was put into encouraging health professionals to ask about smoking status and give advice, 100% coverage would still be unlikely. About 80% of the population visit their GP every year32 and perhaps a higher proportion may be seen by other health professionals. For our simulations we assume a more modest figure, that the interventions will increase the advice given so that an additional 50% of the current smokers receive advice.
The other estimates considered were the willingness of smokers to take up NRT when advised of this as an option. We estimate that about 25% of those making an attempt to stop smoking will try NRT.29If NRT was available or partly available through NHS prescriptions, take up rates may increase. A recent study by Curry et al 33 provides evidence of a positive relationship between the take up of NRT and insurance cover in the USA. Finally, we assume that about 2% of all smokers in a community would use a smokers’ clinic if it was available on the NHS.29
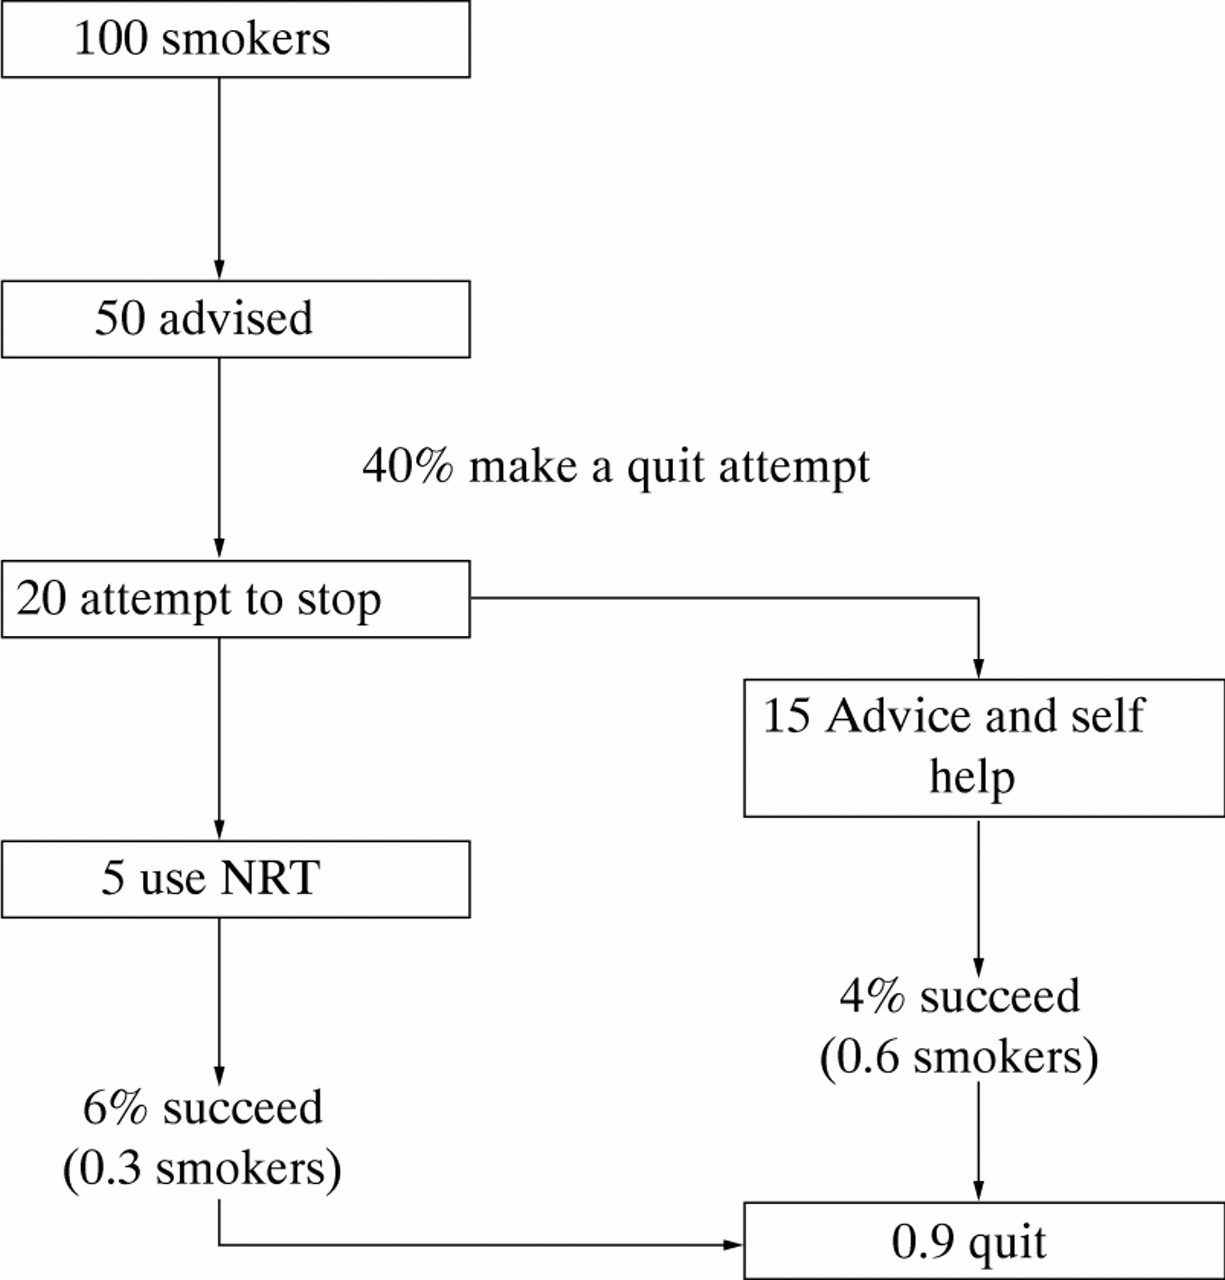
To estimate population impact it is perhaps easiest to look at these effects each year on a group of 100 smokers.
Currently 25 smokers will get advice from a health professional with no additional interventions (the effects of this are taken into account in the baseline simulation).
Fifty additional smokers will receive advice to stop smoking as the result of the interventions put in place locally as simulated in our examples.
Of these 50, some 40% or 20 smokers would make an attempt to quit.
If the intervention consisted of brief advice alone, 3% would succeed in staying off cigarettes for one year (table 11). In other words, 0.6 of a smoker would succeed out of the original 100. Hence the population impact of this intervention is to reduce smoking prevalence rates by 0.6% (fig 3).
If, as well as advice, self-help materials were given, the quit rate would rise to 4% overall for the 20 smokers motivated to make a quit attempt. This would result in 0.8 of each 100 smokers in the population succeeding in staying off cigarettes for one year. Hence the population impact on smoking rates would be 0.8% (fig4).

Derivation of 12 month quit rate following brief advice.

Derivation of quit rate following brief advice plus self help.
The third, and perhaps the most realistic, scenario is that a variety of interventions will be delivered by health professionals including advice to use NRT products. Obviously for this intervention we have to make some additional assumptions of differences in the behaviour of both smokers and health professionals. For our simulations we assumed that, of the 20 smokers wanting to make a cessation attempt, 25% (five) would try to stop smoking using NRT bought from a pharmacy, and the remaining 15 would be given advice and self-help manuals (fig 5).
Derivation of quit rate following brief advice, self help, and NRT advice.
This would result in the following:
of the 5 smokers using NRT, 6% or 0.3 smokers would succeed;
of the 15 receiving advice and leaflets or telephone counselling, 0.6 would succeed;
in total 0.9 would succeed, a population quit rate of0.9%.
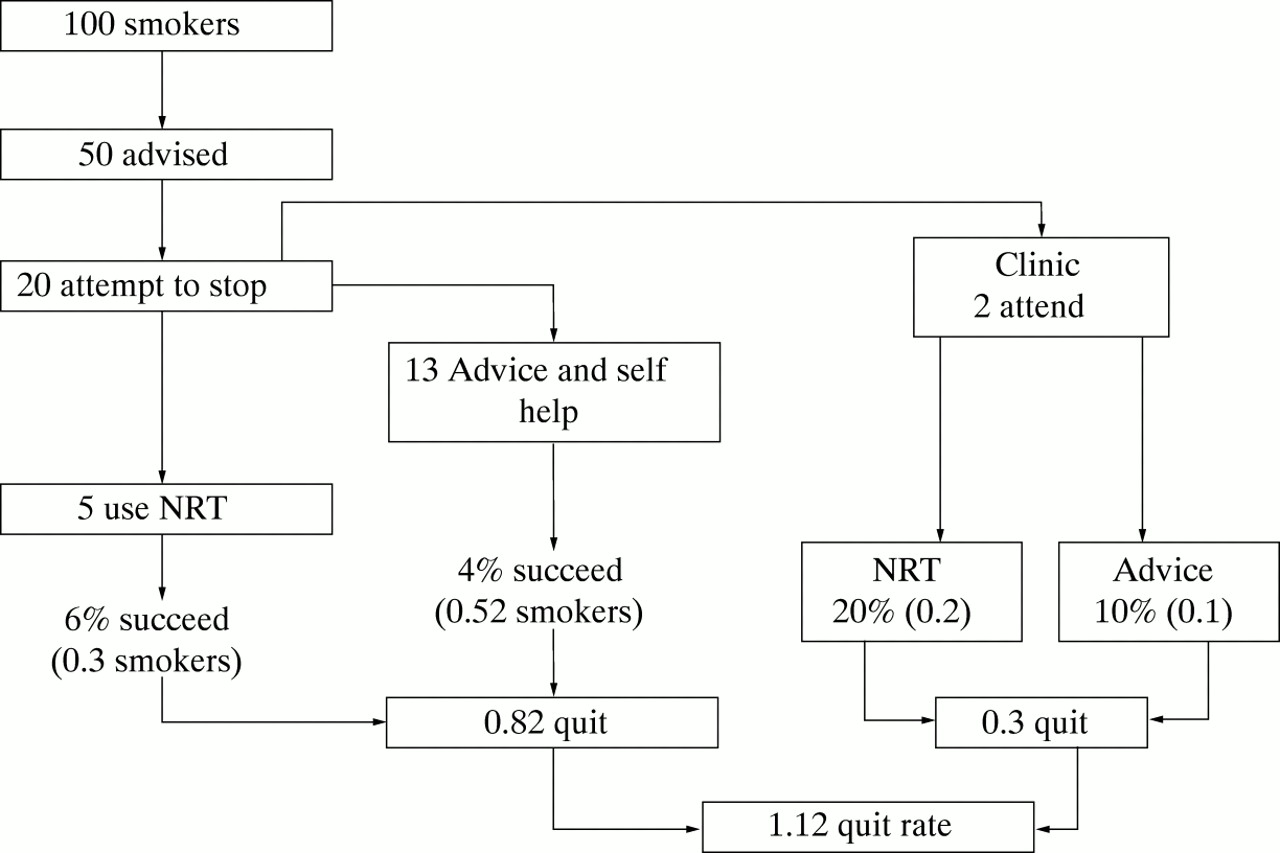
The final intervention includes the provision of a smokers’ clinic run by a specialist. Two out of every 100 smokers would want to take up this service. If one took up NRT and one did not, this would result in 0.3 smokers stopping smoking. If these two smokers were referred to a clinic this would reduce the number receiving NRT from the pharmacy or advice and self-help material. If five of the remaining 18 smokers attempting to stop were to take up NRT and the remaining 13 were to receive advice and self-help material, the results would be:
of the two referred to the clinic, 0.3 quit;
of the five buying NRT, 0.3 quit;
of the 13 receiving advice and a leaflet, 0.52 quit;
the total number quitting from this mixed service would be 1.18 smokers, a population quit rate of 1.12% (fig6).
Derivation of quit rate following brief advice, self help, NRT advice, and provision of smoking cessation clinic.
LIFE YEARS GAINED FROM LOCAL CESSATION INTERVENTIONS
For a health authority with the national average population of 500 000 and national smoking rates, the gains would be those shown in table 12.
Life years gained in typical health authority from face to face interventions
DISCOUNTING HEALTH GAINS
A common feature of health promotion activities is that the benefits (and sometimes costs) are often incurred in the future. It is generally considered appropriate to convert future benefits (and costs) into present day values by discounting. Discounting takes account of the fact that future costs and benefits are valued at a lower rate than those occurring in the current year. This is further explained in Appendix .
A discount rate of 1.5% per annum is used in these simulations following the guidelines published by the Department of Health34 (see table 13).
Discounted life years gained in a typical health authority from face to face interventions
AVERAGE LIFE YEARS GAINED PER SMOKER
These estimates can be used to calculate the average number of life years gained for each smoker who stops. For example, assuming that the health authority undertakes a programme of brief advice only,PREVENT estimates the gain to be 1101 life years per health authority from a 0.6% population quit rate.
The average gain per smoker who stops is therefore 1.54 life years. No allowance has been made for relapse to smoking after one year. However, the estimate still appears to be a conservative estimate compared with the results of other studies when some relapse has been included.
WORKING OUT THE EFFECTIVENESS OF COMMUNITY INTERVENTIONS
Community interventions, such as local No Smoking Day activities and competitions such as “Quit and Win” are typically organised by health promotion units and are an important part of local smoking cessation activities. However, the evidence for their effectiveness is not as strong as for clinical interventions such as brief advice from a GP or advice to use NRT.
Shipley et al 35 investigated the relationship between the resource input to “Quit and Win” contests and the participation rate. A positive relationship between resource intensity and participation was found. The findings from this study have been used to simulate a low cost and low participation intervention, a medium cost and medium participation intervention, and a high cost and high participation intervention.
No Smoking Day is probably the most widely known media based smoking intervention which takes place in the UK. It is very difficult to estimate the costs incurred by society as they are dependent upon the input of individuals into the intervention, which will be extremely variable. The effectiveness and reach of a local No Smoking Day have been based on the findings of Buck and Godfrey.2 The estimates in this guidance are based on the cost of local support for a No Smoking Day. In addition, broader community based interventions of varying effectiveness are estimated based on the Heartbeat Wales campaign.36
However, the evidence base for these community interventions is much weaker than for clinical interventions. This is partly because of the difficulty of doing rigorously controlled trials in a community setting. As a result, there are relatively few methodologically adequate trials on which to base estimates, and very few randomised controlled trials. It is because of this shortage of evidence for the effectiveness of, for example, a telephone help line that we have not simulated them in this guidance, although more evidence may be available in later editions.
The effectiveness and reach of community interventions are shown in table 14, and the effect of community interventions on life years gained in a typical health authority are set out in table 15.
Effectiveness and reach of community interventions
Life years gained in typical health authority from community interventions
Specific populations
The estimates presented above are based on cessation rates for the average smoker. Smokers are not a homogenous group, and it is therefore likely that different estimates would be achieved using different population characteristics.
PREVENT simulations could be made for different cessation rates based on different populations, which could then be used as an input to cost effectiveness analyses for programmes targeted at specific population groups. Alternatively, sensitivity analysis may be conducted where a range of possible effectiveness estimates are used to investigate the robustness of the results.
The worked examples are designed to illustrate a “most likely” scenario which is generalisable to a large population. Work on targeting different groups of smokers may be considered for future editions of this guidance.
Cost
In this section we estimate the costs of the interventions described in Section 3 and compare local costs with those reported in research reports.
Costing issues
Cost analysis is usually undertaken in three major steps:
identifying costs;
measuring costs;
valuing costs difficult to measure (e.g. time).
Few published studies provide detailed cost or unit of resource information, and the costs they do report are usually locally specific. Obviously the resources needed to deliver services will depend upon local circumstances. In our worked examples details are given of the units of resource needed for each intervention, together with their costs.
Identifying major costs requires the construction of a checklist. Costs will depend upon the intervention in question and the perspective of the study. In some cases the measurement of a cost is straightforward as it is naturally valued in monetary units—for example, the cost of premises, staff, heating, lighting, and pharmaceuticals. However, some costs such as patient time must first be measured in non-monetary terms (time) and then translated into monetary units. This is the third stage of a costing study, which requires thevaluation of resources. Economists use the concept of opportunity cost in this valuation stage. The opportunity cost is the health outcome that can be achieved in some other programme(s) forgone when resources are committed to the programme being undertaken.18
Most items in this study have a market price or pseudo-market price, and in general these were used as the opportunity cost.
TYPES OF COST
Costs can be categorised as average costs and marginal costs. Average cost is the total programme cost divided by the total activity level. Marginal cost is the cost of increasing the output of a programme by one unit. For example, the marginal cost would be the cost of increasing the number of clients in a smoking cessation programme by one. Marginal costs are important when service expansion is being considered, or a treatment is to be provided as an adjunct to an existing programme.
Costs to the health care provider include the costs of premises, staff, power and occasionally pharmaceuticals. Costs to patients include time, travel and, possibly, prescription or over the counter costs such as nicotine patches or gum. Other costs fall on society and include the cost of productivity losses if clients’ time in treatment results in absence from work. Also included are the costs incurred outside of the health care sector—for example, by other patients and their families. This follows the classification of Drummond et al,18 although alternative definitions have been put forward.
Several methods have been suggested for valuing the costs of time incurred by clients. Assuming perfect competition in transport markets, the market price of public transport can be used or, for a private vehicle, the average distance to the treatment facility multiplied by a cost per mile estimate. Similarly, prescriptions are usually valued using the prescription charge faced by the client. A more difficult problem is faced by an investigator attempting to value time spent by a client in travel to a facility and during treatment. A technique widely employed is to use the average wage rate, calculated as a per minute figure, to value opportunity cost of time.
COSTS BY SETTING
Checklists of the costs that will be incurred by cessation programmes delivered in the following three major settings are presented below: (1) primary care; (2) specialist smoking cessation service; (3) community based interventions.
Primary care
The precise costs of a programme delivered in general practice will depend upon the type of intervention. Brief opportunistic advice to stop smoking following a routine consultation will involve an element of the GP’s time, plus a proportion of the practice overheads (premises and equipment). This can be calculated on a per minute basis. There will be a time cost to clients, but this will not include the costs of travelling or the time spent travelling as these costs are incurred in making the routine consultation. However, if a consultation is made specifically for the purpose of delivering advice, the travel costs incurred by the patient will also be included. There may also be costs incurred with follow up, such as administration costs and the cost of the GP’s time when writing notes. Table 16 shows the main elements of costs incurred when advice is delivered in the general practice setting.
Costs of a smoking programme in general practice
Specialist smoking cessation service
Since a specialist smoking cessation service is a facility dedicated to helping individuals stop smoking, the whole of the overheads (such as premises, equipment and support staff) are attributable to cessation programmes. Some of the costs are not therefore apportioned to other health care interventions as is the case with the general practice setting.
Costs include, firstly, the premises, equipment, and salaries of staff. There will also be the operating costs of the premises, and the costs of pharmaceutical products and possibly screening. Since patients attend the service for cessation help only, all travel and time costs are included. There may be productivity costs to employers if patients are in employment and visit the facility in paid work time (table17).
Costs of a specialist smoking cessation service
Community based interventions
The costs of a community based programme will be determined by the exact nature of the intervention. The costs of a programme consisting solely of media advertisements will include the costs of producing the adverts, plus broadcast time or newspaper space. However, if these advertisements are used as a means of recruiting individuals to a further programme, there will be further costs incurred, influenced by the number of individuals who see the campaign. These may include prize money for “Quit and Win” competitions or the costs of a structured programme which may be located in a clinic or general practice (table18).
Costs of a community based smoking programme
The issue of overhead costs presents the investigator with a problem as cessation interventions delivered in multi-functional premises such as general practice should have a portion of the total overhead costs attributed to them. Several different methods have been suggested for the allocation of overhead costs.18
METHODOLOGIES FOR IDENTIFYING, MEASURING AND VALUING COSTS
There are two different methods that can be used to estimate the costs of a programme. The most accurate is the prospective method which records costs as they are incurred. The costs to be measured are established before the programme starts and are recorded as the programme progresses. Alternatively, costs can be estimated retrospectively. Retrospective costing involves estimating the costs of a programme by quantifying the resources which have been used, and then valuing these resources using secondary data sources. Such data sources may be the previous year’s costs, costs from another programme, or literature based estimates. Retrospective costing is the most commonly used technique in the smoking cessation literature.
IDENTIFYING, MEASURING AND VALUING OTHER RESOURCE CONSEQUENCES
In addition to the direct costs to the health service of providing a smoking cessation programme, there are costs to clients. These include the time spent in treatment and travelling to a treatment facility, together with out of pocket expenses such as transport costs and prescription charges. In addition, costs may be imposed on employers if patients are currently in employment and attend treatment in paid work time. However, employers may also benefit if employees live longer or have an improved work attendance if the treatment is successful.
A critical aspect in all cost effectiveness studies is the definition and measurement of costs and other resource consequences. It is crucial to know what has been included and omitted from the cost figures reported in any cost effectiveness study. A good study will present a list of the costs which are considered and provide a rationale for their inclusion or exclusion. Appendix provides details of some of the published cost effectiveness studies with tabulated cost information.
Costing smoking cessation interventions
The unit costs of some of the common elements of smoking cessation programmes are considered here and details given as to how costs can be estimated.
COSTING GP TIME
In theory the value of GP time should reflect the opportunity cost, which is the value of the next best alternative use of the GP’s time. In practice, wages and salaries are used as a proxy. The justification for this is that, at the margin, the cost of an additional GP employed by a health authority should equal the marginal benefits which flow to society as a consequence of that employment.28
There is no generally accepted method for costing GP consultations. Previous attempts have tended to concentrate on the cost of an average consultation. Hughes28 argues that, where GP time is likely to be a major part of the cost of the consultation, an accurate estimate of the length of consultation is important. In most circumstances the cost associated with a smoking intervention will not resemble an average consultation because the time required to deliver the intervention will differ between clients.
The opportunity cost of a GP’s time can be derived using two alternative methods.
Method 1
The first method used to derive an upper bound of the costs incurred divides total gross general medical service costs by the number of consultations. We can take the Treasury’s 1995 estimate of £12.77 per consultation in 1993/4 at 1993/4 prices11(£13.49 when inflated to 1996/7 using the Health Service Cost Index) and adjust this to take account of the large difference in time (and therefore costs) between a surgery and home consultation. The ratio of surgery to home consultations can be obtained from the General Household Survey 199337 and, from the DHSS/General Medical Survey,38 the average consultation time at home (13.51 minutes) and in the surgery (8.82 minutes) are available. In 1993 91% of GP/patient contacts were surgery based and 9% were home visits.
Defining:

and assuming:

we can rearrange so:

where ATC = average total consultation cost (£13.49); ASCC = average surgery consultation cost; AHCC = average home consultation cost; S = proportion of consultations taking place in the surgery (0.91); H = proportion of consultations taking place in the home (0.09); THC = average time of a home consultation; and TSC = average time of a surgery consultation.
In 1989/90 the average GP consultation took 8.82 minutes, which enables us to derive an average brief smoking consultation cost from the final equation, assuming that the average consultation takes one minute. This figure includes all GP overheads and acts as an upper bound for the costs associated with a GP smoking cessation intervention consultation. The upper bound (including overheads) is therefore £1.46 per minute.
Method 2
This method assumes that there are no associated overhead costs. In the case of a brief intervention (e.g. advice) specific visits to the GP will not be made, so the only relevant cost is GP time. The average GP works a 38 hour week for nine out of 10 weeks at an average salary of £46 450.39 This lower bound estimate, excluding overheads, is £0.435 per minute.
More intensive interventions require additional separate follow up appointments. This implies additional GP time and administrative expenses. If an additional GP is required by the practice then his/her income, including allowance for overheads, would be a reasonable proxy for the cost. It is unlikely that this will be the case and we therefore assume that no extra GPs are required and that additional overheads will not be required.
The first method of estimating the cost is the upper bound estimate which assumes that the cost of a follow up/intensive intervention will consist of an average GP intervention. This is estimated to be £12.87 per consultation from Equation 3, or £51.48 for a total of four consultations.
The lower bound estimate is a bottom-up approach. We assume that the costs include an additional GP and associated administrative expenses, which are those associated mainly with secretarial duties. In 1995 there were 1.67 whole time equivalent practice staff per GP of which 1.23 were secretarial staff and/or receptionists.40We assume that the same proportion of their time is taken up in administrative tasks as is that of the GP in giving advice, etc. We further assume that the average relevant employee is Grade 3 in the middle band increment (income £9940 in 1996 or £10 115 in 1997 when inflated by the HSCI), and again the average consultation lasts 8.82 minutes. The same amount of time is spent on administration as the GP spends giving advice. This implies £0.435 per GP per minute plus a further £0.095 in administration charges. Average surgery consultation costs (including administration overheads) are therefore £0.53 per minute. The lower bound (including administration overheads) is £4.67 per consultation.
OPPORTUNISTIC AND SPECIFIC CONSULTATIONS
The distinction between opportunistic and specific interventions is an important issue when deciding which method to use when estimating the cost of GP time. If the intervention is opportunistic brief advice dispensed with a prearranged consultation, then the cost of time will not need to be supplemented by a proportion of practice overheads. However, if advice is delivered as a specific consultation, overhead costs must be included. Overheads are relevant if the new intervention imposes significant extra work on ancillary staff so that new buildings or reallocation of space is necessary. This is unlikely and only a theoretical possibility. We therefore assume that the only relevant cost is the GP’s time and use method 2 to estimate GP costs in the following examples.
COSTS OF TRAINING
Health professionals need to be trained to provide smoking cessation interventions and these costs must be included in an intervention. We assume that information is diffused to general practice by training practice nurses. The analysis assumes that the smoking cessation specialist employed by the health authority spends half of his/her time training these nurses in general practice. The cost of the time spent by practice nurses in training sessions must then be added to this cost. We assume there are 100 general practices in a health authority, and a practice nurse from each attends a one day training course. This training is assumed to be ongoing and would be required annually, although the examples below are based on a one year programme.
TRAVEL COSTS
In this study the interventions undertaken in general practice are delivered opportunistically, thus no travel costs are incurred. However, travel costs are incurred for interventions delivered at the smoking cessation clinic as the patient must make additional journeys to the clinic.
We assume that the patient travels an average of three miles to the clinic by private transport. The cost of travel by private transport is estimated at £0.335 per mile41 which is based on a car with a 1400 cc engine and an average annual mileage of 10 000. The travel cost is therefore £2.01 for the return journey. In addition, the patient incurs a time cost when undertaking the journey. Assuming the patient travels the distance of three miles at an average speed of 20 mph, the journey will take nine minutes. The additional cost is therefore £2.74 (18 minutes of patient time multiplied by 15.2 pence per minute). The total cost to the patient for each visit to the clinic is therefore £4.75.
COST OF PATIENT TIME
Patients also incur costs during consultations as a result of the opportunity cost of time spent in the consultation. We assume that a consultation with advice and instructions of how to use NRT takes seven minutes and is part of a routine consultation—that is, the patient does not make a journey to the GP’s surgery especially for cessation help. Using the average wage in 1997 of £9.10 per hour,42this translates to a cost of £0.152 per minute. There is no travelling time as the patient would have made the journey to the surgery anyway. The cost of the patient’s time in the consultation is therefore £1.06 for a seven minute intervention.
COSTS OF COMMUNITY INTERVENTIONS
One of the difficulties of costing community interventions is that a number of different agencies may be involved. Health promotion officers will act as co-ordinators to these programmes but this may only be one of many tasks they are contracted to perform. We have very little information with which to make estimates of the time involved by different individuals in delivering these types of interventions, and estimates at this time have to be provisional. However, local units may have a much clearer idea of the resources needed for planning and undertaking local interventions. It is also important to put in place some useful but low cost means of monitoring resource use, both to evaluate existing programmes and to help in the planning of new initiatives.
Worked examples
We have estimated the costs for England and for a health authority with an average population of 500 000 of the following interventions:
brief advice;
brief advice + self-help materials;
brief advice + self-help materials + advice to use NRT;
brief advice + self-help materials + advice to use NRT + specialist smoking cessation service;
community based interventions.
Most of the interventions are broadly defined. For those conducted in primary care we have assumed that the interventions were conducted by a GP. We recognise, however, that this will under-emphasise the role of other health professionals who may in practice be involved.
For these worked examples a limited range of costs and consequences have been considered, as in many published studies. As stated earlier, depending on whether total costs or only smoking related costs are considered, this exclusion would either increase the value for money of these interventions or possibly marginally decrease the value for money estimate. We have not attempted to estimate the long run consequences to the health service. Costs are estimated separately for the GP or other providers and the patient. Other resources associated with providing the intervention are also included. Costs to society, such as productivity losses, and costs to families are excluded. This exclusion is likely to affect adversely any estimates of value for money.
Compared with the effectiveness evidence, cost estimates are hampered by lack of data. It can be seen from the published studies detailed in Appendix that all authors have made major assumptions with few real life data from which to produce estimates. We have set out the figures in the worked examples as clearly as possible so that different assumptions or base figures can be easily inserted for specific local interventions.
We hope that this guidance will stimulate costing studies and would be pleased to receive further information so that updated editions of the guidance can be based on shared experience and locally relevant data.
FACE TO FACE INTERVENTIONS
In Section 3 the effectiveness figures were simulated for face to face interventions, assuming an extra 50 of each 100 smokers received an intervention each year. To achieve this level of activity, training would be necessary, as well as support, encouragement and monitoring of activities by different professionals. It is our belief that the establishment of a specialist smoking cessation service will prove crucial if this is to happen, and this is recommended in the clinical guidelines.1
For the support and monitoring role it is assumed that these costs can be approximated by the work of a full time smoking cessation specialist in each health authority area, or one such person to serve approximately five primary care commissioning groups. Obviously different models could be put forward to use this resource. The cost was approximated by the salary of a health promotion officer (£24 758), although the professional affiliation of the person would be likely to vary from location to location, and the overhead cost was estimated by adding 40% to the salary costs to give a total of £34 662.
The GPs will require support to provide advice to the extra 50% of smokers. We assume this support will be provided with the help of the smoking cessation specialist and the additional training of practice nurses to provide a link. There are obviously alternative ways of allocating resources, such as the direct training and monitoring of GPs. We assume practice nurses attend a training session for one day, therefore the cost is the salary of a practice nurse (£23 800) divided by working days (230) and multiplied by 100 practice nurses in a health authority. The total training cost is therefore £45 010.
The training and support costs will vary with the number of health professionals involved. In the simulations below they are assumed to be fixed costs, incurred as a “one off” cost of the year long programme. Hence these costs would be incurred even if activity rates did not go up. An alternative could be to vary the intensity of training across several years, if the programme was to run for more than the one year we have assumed. Unfortunately we have no information about the links between variations in the level of support and the activity of health professionals to deliver smoking cessation advice. Given the number of smokers in our average health authority and the implied delivery to 50% of them through this activity (59 685 smokers), it implies on average a cost of £0.75 per smoker receiving an intervention.
The costs considered below vary directly with the number of smokers receiving the intervention, unlike the training and support cost. Total costs will therefore vary directly with the activity actually achieved in the area.
For each intervention we now consider the costs to the health professional and to the smoker. Note that for our worked examples we are using GPs. Other health professionals could be substituted here. It may be that such professionals with different groups of the population would devote more time to each of the examples.
Intervention 1: Brief advice
The average time spent in delivering advice alone is three minutes. GP time is estimated to cost £0.435 per minute, hence the GP cost for each smoker, for advice delivered opportunistically, would be £1.31.
If an additional 50% of current smokers were to receive three minutes of opportunistic brief advice the cost would be:
50% × 119 371 × £1.305 = £77 889
This could be a straight financial cost if GPs were offered extra payments, or this figure could reflect resource use if GPs were providing less of some other activity.
A health authority would therefore incur a cost of £77 889 to provide brief opportunistic advice to 50% of adult smokers. Adding the cost of training gives a total cost of:
£77 889 + £45 010 = £122 899
The patient spends three minutes in the GP’s surgery while the intervention is delivered, at a cost to the patient of £0.46. Since advice is opportunistic, travel costs (time and transport) are incurred anyway as the patient visits for a routine consultation (table19).
Cost per patient: brief advice
The costs to society as a whole would include the value of patients’ time spent in the GPs’ surgeries (£27 216). The total cost to society is therefore £150 116.
Brief advice: total cost to the health authority £122 899
Intervention 2: Brief advice and self-help materials
We assume the self-help intervention to take four minutes (the original GP brief advice plus one minute to explain the material). The cost of the GP’s time will be £1.74 per event and the cost of the patient’s time £0.61.
The unit cost of leaflets and booklets will be highly dependent upon several key factors. Firstly, unit costs would be expected to fall as the number of leaflets produced increased. In addition, the production costs (writing, design, etc) per leaflet are lower as the number of leaflets increases. Secondly, the size of the material will affect production costs. Thirdly, cost will increase as quality improves. For example, costs will be higher for colour publications and glossy paper. The average cost of self-help material is assumed to be £1 per patient. In addition, the training costs (salary of the smoking cessation specialist and time cost of training nurses) must be added (see above).
The GP time to deliver the intervention is estimated to be four minutes, to which must be added the cost of self-help material (table20).
Cost per patient: brief advice + self-help
The total cost from the health authority perspective is shown by:
(59 685 × (4 × £0.435)) + (59 685 × £1) + £45 010 = £208 548
If a societal perspective is being taken, the patient time, estimated to be four minutes, must be included for each individual:
(59 685 × ((4 × £0.435) + (4 × £0.152))) + (59 685 × £1) + £45 010 = £244 837
Brief advice + self-help materials: total cost to the health authority £208 548
Intervention 3: Brief advice, self-help materials, and advice to use NRT
This intervention assumes that doctors advise all patients who are already receiving brief advice to use NRT, advise on how to use it, and offer self-help materials (booklets). This may take further GP time and hence there may be more incentive to use specific appointments as a follow up to an opportunistic visit (although opportunistic advice is still assumed in these examples). If NRT takes an additional three minutes, then the interventions would cost seven minutes of GP time per smoker plus the cost of self-help material.
The next stage requires an estimation of the cost of purchasing NRT products incurred by smokers who took up NRT (five out of every 100, see Section 4). Table 21 shows the retail costs of a course of transdermal nicotine patches. Using the manufacturers’ recommendations for a course of patches, the total cost of such a course is £182.76 (at retail prices).
Pharmaceutical costs 1997: nicotine patches
The costs of providing advice and NRT depend upon the proportion of patients advised to use the therapy. The recommended course of transdermal nicotine patches is one 15 mg patch daily for eight weeks, followed by one 10 mg patch daily for two weeks, then one 5 mg patch a day for two weeks. However, it is unlikely that all smokers using NRT will use the full recommended course. Estimates of the use of NRT are taken from an analysis of NRT use in general practice by Stapletonet al (table 22).44 Estimates of use are given after one week, three weeks, six weeks, and 12 weeks.
Compliance and attendance in a trial of nicotine replacement therapy
The following analysis extrapolates from a linear trend between these point estimates which indicate an average patch use of 60.48 at a total cost of £116.40 (table 23). However, this will be a high estimate as it includes all patients. The study showed that the number of patients attending the general practice declined with time. Patch use and cost of patches are therefore reduced by the proportion of non-attenders to give an estimated consumption of 35.4 patches at a cost of £65.40. This is not directly obtainable from table 23 due to different unit costs for different dosages of patch.
Cost per patient using NRT (full course)
Twenty five per cent of smokers are assumed already to receive opportunistic brief advice to stop smoking per year. If all of the additional 50% of current smokers targeted were to receive advice to use NRT (estimated at seven minutes), in addition to the self-help material, the cost to the health authority would be:
(59 685 × £3.045) + (59 685 × £1) + £45 010 = £286 437
A health authority would therefore incur a cost of £1 in providing the self-help material and advice to use NRT to 50% of adult smokers. The addition of the cost of the health promotion officer and training costs gives a total cost of £286 437. Assuming five of the 20 smokers wanting to make an attempt to quit use NRT, this would be 5969 smokers per health authority. The cost to smokers would be £390 343 in transdermal nicotine patches based on the average patch use as outlined above. In addition, the cost of smokers’ time, valued at £63 505, should be included.
Therefore:
Health authority cost = £286 437
Societal cost = £286 437 + £453 848 = £740 285
Brief advice + self-help materials + advice to use NRT: total cost to the health authority £286 437
Intervention 4: Brief advice, self-help, NRT advice, and a specialist smoking cessation service
In our worked example we assume that two out of every 100 smokers will want to take up the services of a smoking specialist service. However, experience in one London clinic suggests that a realistic throughput would be approximately 500 smokers per annum. This may be lower than the number of smokers who express a willingness to attend a clinic due to factors such as difficulties getting time off work or travelling and unwillingness to go out at night.
We assume that the resources to operate a clinic would consist of:
One clinical nurse specialist (an H grade nurse).
One full time secretary (computer literate).
Premises: three rooms including one room for group sessions (half time), one room for the therapist (full time), and one room for the secretary (full time). The therapist’s room and the secretary’s room are assumed to be 100 ft2 each. The room for group sessions is assumed to be 400 ft2 and is used for one quarter of total available time. The clinic therefore occupies 300 ft2 of floor space. Using estimates from a study at Newcastle City Hospital, the estimated cost of the clinic is £5180. This includes building maintenance, engineering, capital charge, energy, and the site overhead.
Telephone, stationery, photocopying, and postage. Costs are taken from a study of the Smoking Cessation Service undertaken by the Canterbury and Thanet Health Promotion Unit45 as £750. Computer costs of £500 per year are also included, based on an estimated purchase cost of £2000 and life expectancy of four years. This could alternatively represent depreciation if the equipment was sold after one year.
Taking a salary of £22 180 for the therapist, and adding £1847 employer National Insurance contributions and 4% employer pension gives a total employment cost of £24 914. A salary of £17 684 for the secretary gives a total staff cost of £42 598. To this needs to be added £5180 for the room rental and the cost of stationery, telephone charges and computers, estimated as £750. The total cost is therefore £49 028 (table 24).
Costs of a specialist smoking cessation service
Costs will be incurred by smokers attending the clinic. We assume an average distance of three miles to a smoking cessation clinic, made by private transport at an average speed of 20 mph. This gives a cost of £2.01 for a return journey in travel costs plus £2.74 in time costs. This is incurred for each session at the clinic by the 2% of smokers who attend the service.
The time costs in general practice are assumed to be seven minutes for smokers not advised to attend the clinic, and these receive brief advice, self-help material, and NRT advice. The 2% of smokers advised to attend the clinic are assumed to receive advice lasting four minutes (table 25).
Cost per patient attending clinic
The cost to the health authority for the more comprehensive set of interventions (all four) is £331 156 plus £803 757 to smokers which includes the cost of NRT, travel, and time costs. Thus, the total societal cost is £1 134 913.
Brief advice + self-help + NRT + specialist smoking cessation service: total cost to the health authority £331 156
Community interventions
QUIT AND WIN
The following section provides details of the costs of community interventions incurred by the health authority. Estimates of the total cost to society could not be made as the costs are highly dependent upon exact specification of the programme. The estimates of effectiveness are based on Shipley et al.35The three scenarios presented are a contest based on minimum resources, a medium resource/reach intervention, and a maximum intervention. The authors found resource input to be related to participation (table 26).
Effectiveness and resource intensity of Quit and Win interventions
Using these three scenarios, the total costs of the smoking contests can be estimated as shown in table 27.
Estimated costs of Quit and Win contests to a health authority
COMMUNITY WIDE CAMPAIGNS
Phillips and Prowle36 provide an economic analysis of the Heartbeat Wales programme. The cost to the NHS in 1988/9 was £167 000. The population of Wales in 1988 was 1 386 500 males and 1 470 500 females. Smoking prevalence was 37.1% for males and 30.7% for females. Scaling down the costs of the programme to a typical health authority and inflating to 1997 prices gives a programme cost of £30 042.
NO SMOKING DAY
Reid and Smith46 estimated the cost of National No Smoking Day to be approximately £545 800 (inflated to 1997 prices). Although in reality the national budget is supplemented by local resources, for the purposes of this work we have simply divided the total cost between the 100 regional health authorities amounting to £5458 per health authority. We assume that costs to GPs are negligible, although there may be some costs if GPs see higher levels of activity. Costs to smokers are not included, although there may be some costs incurred if smokers subsequently seek advice on cessation techniques.
The costs of face to face interventions and community interventions to a health authority are summarised in tables 28 and 29.
Costs of smoking cessation interventions to a health authority: face to face interventions
Costs of smoking cessation interventions to a health authority: community interventions
Cost effectiveness
In this section we summarise the cost per life year saved of the four face to face interventions and the community programmes described in Sections 3 and 4.
Cost effectiveness
Cost effectiveness data provide a guide for commissioners by informing them of the approximate price at which an additional unit of output can be purchased. For example, the results indicate the cost at which purchasers can purchase an extra year of life for a smoker who stops.
However, these estimates only provide general guidance. They indicate the likely benefit from a particular investment, but costs and benefits will be specific to local populations and their characteristics.
Cost effectiveness results depend upon the alternative interventions being compared and the question being addressed. Many published studies, as outlined in Appendices and , compare a new intervention with either “doing nothing” or “current practice”. The question addressed is therefore whether smokers should receive the new intervention rather than current practice or doing nothing.
Buck et al 7 examined cost effectiveness in terms of the additional costs and effects—for example, either brief counselling or NRT therapy over and above smokers receiving brief opportunistic advice. In the worked examples presented in this guidance we have examined a different scenario. What could health commissioners expect from a range of smoking cessation programmes over and above current cessation activities? The programmes of face to face interventions were designed to offer smokers an increasing range of elements.
The estimates in tables 30 and 31 present the overall cost effectiveness estimates of the interventions outlined above, over and above current practice. These are the figures relevant to a commissioner considering implementation of one of the programmes in addition to current practice.
Cost effectiveness estimates (health authority)
Some health authorities may have already implemented some part(s) of the programmes outlined, and therefore wish to examine the costs and benefits of expanding their service. Economists examine these marginal decisions using incremental cost effectiveness ratios. Incremental cost effectiveness ratios are presented in Appendix .
Summary of the cost effectiveness of smoking cessation interventions for a typical health authority
We here present estimates of the cost effectiveness of the smoking cessation interventions outlined in Sections 3 and 4 of this guidance.
The average population of a health authority is almost 500 000. This would include 210 753 adult men and 208 044 adult women. Applying the smoking prevalences from the 1996 General Household Survey47 of 29% of men and 28% of women implies that the health authority would include 61 118 male smokers and 58 252 female smokers.
BRIEF ADVICE
Twenty five per cent of smokers are assumed to receive opportunistic brief advice to stop smoking per year (see Section 3). The estimated cost of providing this brief advice opportunistically to an additional 50% of all smokers would be £122 899. ThePREVENT estimate for this intervention above the baseline simulation would be 1101 life years (708 life years when discounted). The estimated undiscounted cost effectiveness to the health authority is £112 per life year gained. Including the cost of patient time, this cost increases to £136 per life year gained.The cost to the health authority is £174 per discounted life year gained, and to society is £212 per life year gained.
BRIEF ADVICE AND SELF-HELP MATERIALS
The cost to the health authority of providing the brief advice plus self-help intervention is £208 548.PREVENT estimates the result to be 1469 life years gained (945 life years when discounted). The undiscounted cost to the health authority is £142 per life year gained and to society £167 per life year gained. The cost to the health authority is £221 per discounted life year gained and to society £259 per discounted life year gained.
BRIEF ADVICE, SELF-HELP MATERIALS, AND ADVICE TO USE NRT
The cost to the health authority of providing self-help and advice to all smokers to use NRT is estimated to be £286 437.PREVENT estimates the result to be 1653 life years gained. The estimated cost effectiveness to the health authority is £173 per life year saved. The cost to society would include the cost of purchasing the NRT and the time spent in GP consultations. The total cost to society is £740 285. The cost effectiveness to society is £448 per life year saved. The cost to the health authority is £269 per discounted life year gained, and to society is £696 per discounted life year gained.
BRIEF ADVICE, SELF-HELP, NRT ADVICE, AND A SPECIALIST SMOKING CESSATION SERVICE
The total cost to the health authority of the brief advice, self-help, NRT, and cessation service intervention is estimated at£331 156. Using the effectiveness evidence presented in Section 3, we estimate that the provision of a clinic would result in2022 life years gained per health authority (1300 life years when discounted). If the costs and effectiveness results are combined, the cost to the health authority is £164 per life year saved whilst the cost to society is £562. The cost is £255 per discounted life year gained to the health authority and £873 per discounted life year gained to society.
Community interventions
As we have said above, we are less sure of the figures for community interventions because they are based on weaker evidence for effectiveness.
“QUIT AND WIN” COMPETITIONS
Shipley et al 35 provide three scenarios of varying resource intensity and participation. Simulating the low resource/low participation scenario with PREVENT provides an estimate of 30 life years gained per health authority at a cost of £32 233. The cost effectiveness of such a contest is £562 per life year saved. Discounting this shows the cost to be £874 per discounted life year saved.
The medium resource use/medium participation scenario is estimated to save 185 life years at a cost of £102 667. The cost per life year is shown to be £542. Discounting the life years saved shows the cost to be £842 per discounted life year saved.
Finally, the cost of the high resource intensity and high participation contest is £427 380. Such a contest saves an estimated 571 life years at a cost of £735 per life year. Discounting the results provides an estimate of £1143 per discounted life year saved.
LOCAL NO SMOKING DAY ACTIVITIES
The estimated cost of No Smoking Day is £5458 per health authority. Using the estimated effectiveness of 0.15% (see Section 3), an estimated 248 life years are saved. The cost per life year is therefore £22. If life years are discounted, the saving is 160 years at a cost of £34 per discounted life year saved.
BROADER COMMUNITY INTERVENTIONS
The cost of the community campaign Heartbeat Wales36to the NHS was £167 000 which would represent £30 042 for a typical health authority. Three different effectiveness estimates (see Section 3) were modelled using PREVENT. The low effectiveness assumption yields an estimated saving of 92 life years per health authority at a cost of £328 per life year. The medium effectiveness assumption saves 183 life years at a cost per life year of £164, compared with £33 per life year for the high effectiveness scenario.
Discounting the results gives estimates of £509 per discounted life year (low effectiveness), £252 per discounted life year (medium effectiveness), and £51 per discounted life year (high effectiveness).
However, these simulations ignore the relationship between resource intensity (and therefore cost) and effectiveness.
Conclusions
There is a considerable evidence base to support smoking cessation interventions but fewer data are available on cost effectiveness. Guidance has been provided which should aid practitioners and commissioners in demonstrating the value for money using locally relevant data. The worked examples have been chosen in order to illustrate the potential population health gains and costs from interventions implemented across the whole population. However, the estimates provided have to be used with some care and are based on a range of assumptions which would need to be checked against local data.
Research suggests that this general smoking cessation activity, especially specialist help, is currently at a low level. In practice, health authorities may wish to look at a range of targeted or different types of interventions, especially when aiming to reduce inequalities. The costs and health gains of such types of interventions could be simulated in a similar way to the worked examples provided here. In particular, smoking cessation programmes for pregnant women have been shown to be very cost beneficial.2 The worked examples assumed that health authorities were already delivering smoking cessation activities. The calculations assumed additional resources being devoted to reducing the rates of smoking. Obviously other criteria may influence the choice of how to spend these resources.
The worked examples demonstrate the cost effectiveness of programmes to aid people to stop smoking in a stepwise progression. For a typical health authority a comprehensive programme of face to face smoking cessation interventions could be implemented at an annual cost of £331 000. Such a programme is estimated to save 1300 life years over a 40 year period. In cost effectiveness terms our estimates range from £212 to £873 per discounted life year gained. These estimates compare very favourably with most health care procedures. In fact, a recent international review found the median societal cost of over 310 medical interventions to be £17 000 per life year gained.3
We have also provided some estimates of the cost effectiveness of community interventions. However, the evidence base for such programmes is less robust and, indeed, some of the figures are based on only one study where the research design was weak. These figures for community interventions should therefore be treated with caution and used as a rough guide only.
The overall conclusion of this guidance is that, even if these figures are substantially over-optimistic, smoking cessation remains better value than many life preserving medical interventions.
A review of smoking cessation cost effectiveness studies
One possible step for planning smoking cessation interventions would be to draw on existing cost effectiveness studies. In an earlier HEA published report Buck and Godfrey2discussed these studies in a review which was updated for this guidance. All studies with a primary focus on the cost effectiveness of smoking cessation interventions were included. This does exclude some of the multirisk factor interventions where smoking may have been one of the risk factors addressed.
As for the previous study, the literature was divided into three areas: face to face interventions, community and mass media interventions, and smoking in pregnancy. No new studies of the cost effectiveness or cost benefit analysis of smoking in pregnancy were identified. It is also important to note that most of the studies suffered from similar shortcomings to previously published studies when considering applicability in the UK. The studies are predominately US based. Most use reviews of effectiveness data and crude estimates of cost rather being prospective costs and effectiveness studies. Also many of the effectiveness estimates are taken from research trials which may not reflect UK practice. However, the studies do illustrate some of the issues which need to be considered in any local area.
Face to face interventions
Table 32 provides a summary of studies of the cost effectiveness of face to face interventions, extending the review from Buck and Godfrey.2 Further details of some of the more recent studies are provided in Appendix .
Summary of the cost effectiveness of face to face interventions
Law and Ling Tang55 undertook a review of the efficacy of interventions intended to stop people smoking. Using estimates derived from the literature, the authors suggest that the advice of a GP, which costs about $10 in the USA or £4 in the UK, can save a life at the cost of $1500 or £600.
The cost effectiveness of the transdermal nicotine patch was investigated by Fiscella and Franks.54 The authors attempted to estimate the cost effectiveness of the addition of a nicotine patch to smoking cessation counselling in a population of male and female smokers aged 25–69 in primary care in the USA. The costs used in the study were based on GP time ($6.67 per session) and the retail cost of the patch ($111.90 for a one month supply). Benefits were measured in the number of quality adjusted life years (QALYs) saved, discounted by 3% annually. The results of the study showed the patch to produce one additional lifetime quitter at a cost of $7332. The cost effectiveness of the patch was different between age groups and ranged from $4390 to $10 943 for men and $4955 to $6983 per QALY for women. The cost effectiveness could be increased by 25% by limiting prescription renewals to patients successfully abstaining for the first two weeks of the programme. This makes sense because most failures occur within the first two weeks. The authors concluded that their findings supported the routine use of the nicotine patch and the health insurance coverage of nicotine patch therapy. The study was, however, criticised for the absence of long term (one year or more) follow up rates, and the omission of any other costs apart from those borne by third parties.56
A similar question was addressed by Wasley et al.52 The effectiveness of the transdermal nicotine patch with brief counselling and of brief counselling alone was extracted from meta-analysis of clinical trials. The benefits were measured in terms of years of life saved and discounted at 5%. The costs used were physician’s time and patch prescriptions, and the incremental cost effectiveness was quantified as the cost per additional life year saved when counselling plus the nicotine patch was compared with brief counselling alone.
The results showed that the average cost of a life saved varied from $965 to $1585 for men and from $1634 to $2360 for women, the variations depending on age. The incremental cost per life year saved ranged from $1796 to $2949 for men and from $3040 to $4391 for women. The authors concluded that the patch was less costly per life year saved than other widely accepted practices, and that the patch should be recommended to patients wanting to stop smoking.
The cost effectiveness estimates from the two studies are different, although the findings of both studies would indicate that patches are more cost effective than gum as an adjunct to physician counselling57 using the results of Oster et al.58 However, Cheung and Tsevat57criticise all three studies because of the omission of cost savings as a result of reductions in smoking related disease or the costs of increased medical expenditure due to the years of life gained. There is no consensus as to whether these costs should be included in studies as discussed in Section 2.
Akehurst and Piercy50 estimated the cost effectiveness of the Nicorette transdermal nicotine patch as an adjunct to GP counselling alone. Estimates of the effectiveness of GP counselling alone and the nicotine patch were taken from the literature and were assumed to be 2.7% and 10.7%, respectively, against a natural quit rate of 1% per annum. The simulations were based on a cohort of 1000 representative smokers in England and Wales and were performed usingPREVENT. Results for the cohort showed life years gained to be 54.7 for counselling only and 139 with the use of patches (13.05 and 35.17 years, respectively, when discounted at 6%). The average cost of a GP consultation is estimated to be £8 and, for a full course of patches, a cost to the NHS of £100.12 is used. Combining the cost and effectiveness information, the authors showed the cost effectiveness of GP advice only to be £613 per life year gained compared with £3074 for the patch. However, the marginal analysis shows that, by using the patch as an addition to GP counselling, the marginal cost per life year gained is £4526. The authors conclude that the costs per life year gained are probably overestimated as not all causes of death associated with smoking are included and the substantial costs associated with smoking related disease are also omitted. Comparing the estimates to the cost per life year gained from other medical interventions, both transdermal nicotine patches and GP counselling offer good value for purchasers’ money.
Warner59 has also reviewed the cost effectiveness of face to face smoking cessation interventions. He suggests that some of the more intensive interventions had not at the time of his review been subject to cost effectiveness analysis but that, despite differences between studies, there seemed to be some consistent findings. The least intensive interventions such as brief advice or the use of self-help manuals yielded more favourable cost effective ratios than the use of NRT as an adjunct to brief advice. NRT has been found to be more effective in effectiveness reviews, approximately doubling effectiveness rates, but costs have been proportionally more than this increase in effectiveness giving a high cost per unit of effectiveness. As indicated in Buck et al,7 this conclusion depends crucially on the perspective taken as, in the UK, this NRT compares favourably with advice alone when considered just from the NHS perspective. One factor mentioned by Warner59 is the effect of different interventions on different types of smokers. There is also scope for considering the cost effectiveness of a stepped programme of care.
Cromwell et al 60 have estimated the cost effectiveness of putting the AHCPR guidelines into practice. In contrast to other studies they conclude that, the more intensive the intervention, the lower the cost per QALY saved. Unlike previous studies, in this study interventions by smoking cessation specialists were considered. In effectiveness studies these have been found to have significantly higher cessation rates. The authors also calculated the cost effectiveness of combined interventions based on smokers’ preferences for different types of the five basic interventions. They estimate that it would cost $6.3 billion in the first year to fully implement the guidelines and, as a result, society would gain 1.7 million new quitters at an average cost of $3779 per quitter, $2587 per life year saved, and $1915 per QALY.
There are considerable issues in modelling the cost effectiveness of NRT treatments, especially as in the effectiveness trials NRT is often supplied free of charge whereas in reality patients have to bear some or all of the costs and this may impact on their compliance with the treatment. Cox et al 61 investigated the effect of offering gum free of charge to study participants. A study population of 454 smokers at the Travis Air Force Base, California were either offered gum free of charge or purchased gum from their local pharmacy. The cessation help included an eight session behavioural modification group programme. Of the 375 participants at follow up, 137 obtained free gum and 207 purchased gum. Thirty one participants did not use gum. Abstinence was determined by telephone contact at three, six, and 12 months following the last session. Results showed a success rate of 23% amongst those not using gum, 38% amongst those receiving free gum, and 27% for those who had to buy gum. The differences were statistically significant. Providing gum free of charge also increased the use of gum and the duration of use.
The cost effectiveness of a smoking cessation programme after myocardial infarction was investigated by Krumholz et al.51 This is an example of a situation in which smoking advice could be routinely given. Patients recovering from myocardial infarction were either given no cessation help or referred to a cessation nurse managed programme. The programme involved meetings with nurses, a regular brief telephone follow up after treatment, and explanation of identifying high risk smoking situations and counselling about how to cope with the temptation to smoke. The cost of nurses’ time was estimated to be $30 an hour and the cost of a manual was $10 per patient, giving a programme cost of $100 per patient. Indirect costs to patients and costs of additional care in future years were excluded.
The study showed the cost of the programme compared with usual care to be $380 for each individual who quit smoking. Each person who stopped smoking gained approximately 1.7 years compared with those who continued to smoke. Dividing the cost per ex-smoker ($380) by the number of years saved (1.7) gives an estimated cost effectiveness of $220 per life year saved. Varying the cost of the programme using sensitivity analysis showed that, even if the costs were as high as $2000 per participant, the cost effectiveness would be $10 000 per year of life saved providing the programme had a success rate of at least 12%. The cost effectiveness would also be higher if it is assumed that cessation prevents reinfarction.
Community and mass media interventions
Leinweber et al 53 provide estimates of the cost effectiveness of a “Quit to Win” contest in Medicine Hat, Canada. A promotional brochure was used to explain the rules and included an entry form. Demographic and smoking history data were collected and a “buddy” to verify the contestant’s smoking status was nominated. The media campaign included radio and newspaper advertisements, and the grand prize was a trip to California.
The direct cost of the contest was $2651 which included radio and newspaper promotion, printing of brochures, poster displays, and a share in the grand prize. The cost was equivalent to $35 per contestant or $165 for each of the 16 one year abstainers. The majority of the cost was attributable to media promotion (62%), with 24% for prizes and the remainder for printing, display material, and postage. The authors point to a similar programme in Finland (the National TV Smoking Cessation Program and Contest) which achieved a lower total cost of $24 for every six month abstainer.70 The programme was conducted nationally for a much larger population with one major prize. Lower costs per quitter are then attainable as a result of economies of scale.
Community stop smoking contests were evaluated by Shipley et al 35 using data collected from 11 COMMIT intervention communities. Twenty six contests were conducted, each having procedural similarities. Contests were promoted extensively in the community and contestants were required to register during a 2–3 week period before the contest; self-help materials were provided for contestants and the grand prize was $1000 cash or equivalent. The project inputs included staff and volunteer labour at $15/hour, with a mean across contests of $8350. Total prize values averaged $2634 and media costs were $7298. The average total cost of the contests was $24 857 and a positive relationship was found between participation and resources used in the contest. From an unpublished follow up of 188 participants in the first contest an eight month continuous abstinence rate of 16% was calculated. Using this figure as an approximate quit rate from the 26 trials, the mean COMMIT dollar expenditure per successful eight month abstainer was $199. Including staff labour and contributed community resources, the estimated cost per abstainer increases to $428. The authors conclude that the higher estimate is considerably lower than those associated with many other stop-smoking interventions, including physician advice to stop smoking and advice plus nicotine gum.
Consecutive samples of 84 individuals requesting a self-help manual and 83 participants in group sessions in a Dutch community based smoking cessation programme were subjected to pretreatment and six month follow up interviews in a study by Mudde et al.49The programme had been publicised by local media and by GPs to encourage smokers to call a local telephone quit line staffed by Municipal Health Services staff who advised smokers over their choice between the two modalities. Of the 417 calls, 71% resulted in sending out self-help manuals and 28% in participating in group programmes. Costs of the interventions included $25 hourly wage rate for trainers, and a cost of $10 an hour for group participants. Transportation costs of $1.50 per meeting were also included, with an estimated half hour travelling time for each session. The manual was estimated to cost $3.24 per capita.
Results were adjusted for differences in previous quit attempts, addiction, and self-efficacy to yield estimates of 12% successful quitters in the self-help manual group and 23% amongst the group participants. Cost effectiveness estimates were presented from different perspectives. The total cost to society of the programme was $58 352. Operating costs for the group sessions were 3.8 times higher from a societal perspective and five times higher from the perspective of the group participants. In terms of operating cost effectiveness ratios, the self-help modality was more cost effective than the group programme ($74.44 versus $193.99), whilst the difference was more significant from the participants’ perspective ($178.75 versus $666.70). The authors concluded that the programme appeared to be much more cost effective than many other medical interventions and, when including savings in terms of reduced cigarette consumption, the programme represented a profitable social investment of $3600.
A workplace smoking cessation programme was assessed in a computer analysis conducted by Warner et al.71 A cessation programme took place in year 1 and the effects were projected through time, taking into account a background trend in a reduction of smoking rates in the community. The authors present a simulation for a workforce of 10 000 employees, and a cessation programme costing $150 per participant. The $150 represents a group rate for a strong intervention with multiple sessions and sound behavioural counselling techniques. The estimated cost per cessation in the first year was $1029. This rises through time as a result of employees leaving, retiring and background quitting. In the final year of the intervention (year 85) the cost per life year saved was $894. However, this is solely the health benefit and excludes the economic benefits to the firm which include reductions in health care costs (for a self-insured firm or an organisation that pays experience rated premiums), lower absenteeism costs, savings in on-the-job productivity losses, and life insurance costs.
Ratcliffe et al 72 present the results of an evaluation of a mass media campaign by the Health Education Board for Scotland which involved media advertising, a booklet on how to stop smoking, and Smokeline, a free telephone help line. A panel of 970 adults were recruited from a 10% (n = 8547) random sample of callers to the Smokeline telephone help line. Information about time spent as a non-smoker and smoking status after one year was available for 587 panel members. At the 12 month follow up 9.88% (n = 58) of the follow up sample reported themselves as non-smokers, having stopped smoking for at least six months in the previous year. The estimated total cost of the anti-smoking campaign was approximately £1.5 million. The discounted cost per life year saved estimates ranged from £304 to £656, using the upper and lower bound estimates of the number of Smokeline callers.
A summary of the studies of cost effectiveness of media interventions is presented in table 33.
Summary of the cost effectiveness of media interventions
Smoking cessation during pregnancy
Smoking during pregnancy is linked to low birthweight and an increased risk of death during early life, increased risk of some cancers, together with learning difficulties. Cost benefit analyses of cessation interventions during pregnancy are likely to show net benefits as the costs associated with the care of low birthweight children are substantial. Smoking cessation programmes yield benefits to both pregnant women and the children of pregnant women so should provide very favourable results when an economic evaluation is undertaken.
Estimates of the cost effectiveness of these interventions are not included as simulations are not possible using the computer model used in this guidance. Such simulations are an interesting potential for further research and estimation of the differential quit rates and effects on neonatal outcomes. However, table 34 presents a summary of the results of key cost effectiveness studies and is taken from Buck and Godfrey.2 No new studies were found in our updated review.
Cost benefit analyses of smoking cessation interventions during pregnancy
Undiscounted incremental cost effectiveness estimates (health authority)
Discounted incremental cost effectiveness estimates (health authority)
Undiscounted incremental cost effectiveness estimates (society)
Discounted incremental cost effectiveness estimates (society)
An introduction to discounting
In general, people would prefer to have £100 now to £100 in the future. This implies that £100 next year is worth less, say £95, than £100 this year. Similar arguments apply to health benefits: in experiments people have been shown to prefer to be healthier in the present than in the future. Benefits occurring in the future should therefore be valued less, or discounted.
Discounting is not possible when process or intermediate outcome measures are used as they do not relate to final health benefits. Discounting life years gained or QALYs, however, has important implications for the cost effectiveness of health promotion compared with other health care treatments.
In economic evaluations the discount rate that should be used is a contentious issue. Rates of 5% and 6% are commonplace. The formula for discounting is shown below.

which generalises to:

In most cases costs are incurred immediately—for example, a national No Smoking Day—and remain undiscounted; in contrast, benefits are delayed and therefore heavily discounted.
Prevention activities therefore appear less cost effective than, for example, acute care because the benefits from treatment or cure options tend to occur in a shorter time scale and are thus discounted to a lesser degree.
Incremental cost effectiveness
In the examples shown in tables 35-38 brief advice is compared with current practice. Estimates are not provided for the clinic intervention as it is not a simple increment to the previous programme, since all individuals do not receive the same intervention inten-sity in general practice (if the GP believes patients require the clinical intervention, the patient receives four minutes of advice as opposed to the seven minutes for patients receiving the advice, self-help, and NRT intervention).